
 Andrew Peeke
| Position | Right Defense | Current Team | Utah Mammoth |
| Shoots | Right | Current Contract | 1 year ($1,000.0K CapHit) |
| Height | 6'3" | Expires | 2026-27 |
| Weight (lbs) | 214 | Expiry Age (Jun 30) | 29 |
| Age (DOB) | 28 (Mar 17, 1998) | Expiry Status | UFA |
| Drafted | 2016, Round 2, Overall 34 (CBJ) |
| Date | Team | Transaction | |
|---|---|---|---|
| Jul 3, 2026 | Utah Mammoth | Signed 1 year @ $1.000M AAV starting in 2026-27 | |
| Sep 28, 2022 | Columbus Blue Jackets | Signed 3 years @ $2.750M AAV starting in 2023-24 | |
| Aug 9, 2021 | Columbus Blue Jackets | Signed 2 years @ $787K AAV starting in 2021-22 | |
| Apr 1, 2019 | Columbus Blue Jackets | Signed to an entry level contract. |
Player Card(s)
URL: https://thestanleycap.com/cdn/player_cards/20252026/andrew-peeke-8479369.png
URL: https://thestanleycap.com/cdn/player_cards/20242025/andrew-peeke-8479369.png
URL: https://thestanleycap.com/cdn/player_cards/20232024/andrew-peeke-8479369.png
About Player Cards
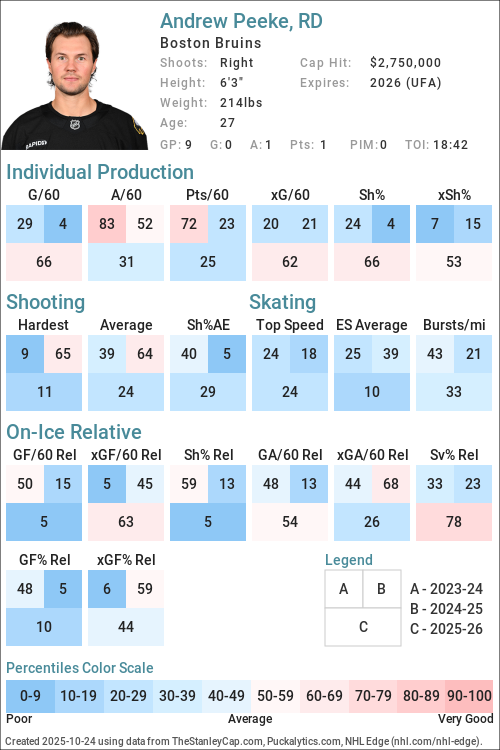
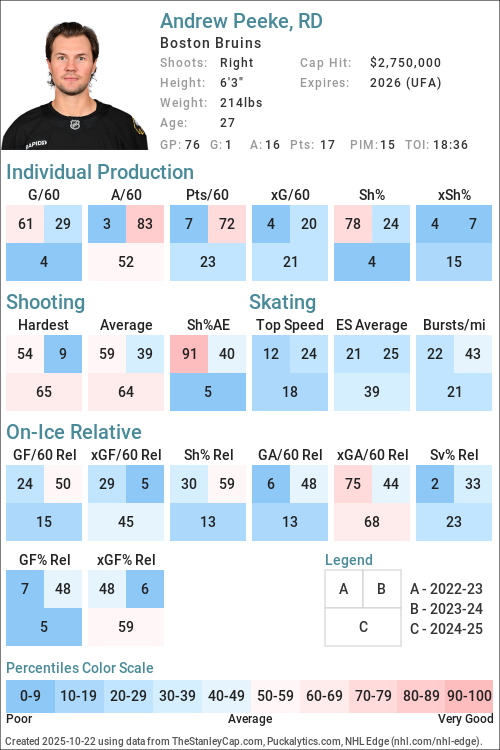
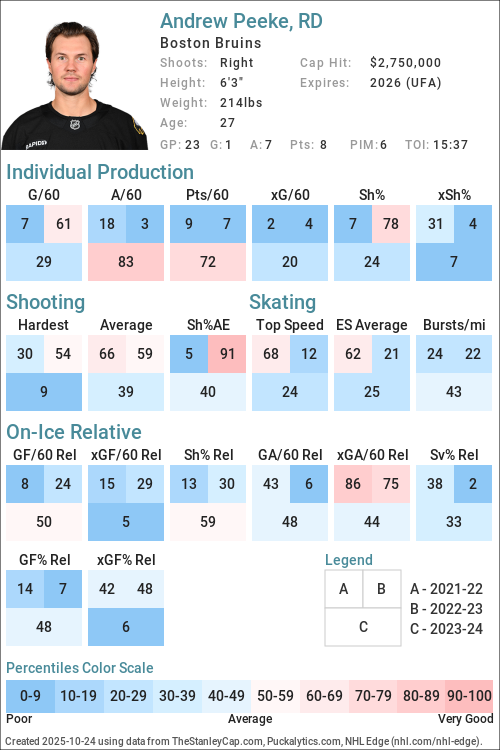
Player cards present an infographic of a players performance using a series of Player Archetypes developed for Puckalytics.com and TheStanleyCap.com. The boxes in the rink image show the archetype ratings for the season specified in the card while the graphs to the right show the five-year trends for those archetypes.
Except for Faceoffs, the values shown are the players z-score (standard deviation from the mean) for the specific metric used to calculate the archetype values. When calculating z-scores forwards were compared to forwards and defensemen were compared to defensemen. Positive values indicate the player is above average and shaded in blue, while negative values indicate the player is below average and shaded in pink. The five year trend charts show a range of -4.0 to 4.0.
The value shown for Faceoffs is the faceoff winning percentage rather than their z-score with winning percentages below 50 in pink shades and above 50 in blue shades.
All archetypes are 5v5 except 5v4 TOI, 4v5 TOI, Skating (even strength) and Faceoffs (all situations). Archetypes use regular season data only.
Archetypes Summary
- Sniper - Measures the to score above the expected goal rate.
- Rebound - Measures the percent of a players shot attempts that come from rebounds (forwards only).
- 5v4 TOI - Powerplay ice time, calculated as the percentage of his teams 5v4 ice time that the player was on the ice for.
- Shooter - Measures whether a players points come from shots (goals or assists on rebounds from his shots).
- Producer - Measures a players ability to produce goals and assists, adjusted for quality of teammates.
- Playmaker - Measures whether a players points come from passes.
- Drive - Measures a players ability to drive puck possession and generate shot attempts for his team.
- Rush - Measures the percent of a players shot attempts that come from rush plays
- Possession - An indicator of a players ability to improve his teams puck possession game.
- Faceoffs - Faceoff Winning Percentage (min. 75 faceoffs taken).
- 5v5 TOI - The percentage of his teams 5v5 TOI that the player was on the ice for.
- Suppress - Measures a players ability to suppress opponent puck possession and shot attempts against.
- Skating - An indicator of a players skating ability, or speed bursts above 20mph per mile skated.
- Defend - An indicator of a players ability to suppress shot quality against.
- 4v5 TOI - Penalty Kill ice time, calculated as the percentage of his teams 4v5 ice time that the player was on the ice for.
Data Sources
- Salary data is from TheStanleyCap.com
- Skating data is from NHL Edge
- Other statistics are from Puckalytics.com and derived from data from NHL.com
Terms of Use
You are free to use include player cards in written articles, share on social media, or on other public websites under the following conditions:
- You credit TheStanleyCap.com as the source and provide a link back to TheStanleyCap.com or this player page.
- You do not mass copy/duplicate/publish dozens or hundreds of player cards. A few, or a handful for a written article is fine. Be reasonable. Fair use rules apply.
- If you are a high-traffic website you must download and host the image(s) on your site rather than overload TheStanleyCap servers with traffic.
Note: Player cards will update daily throughout the season so if you want to include snapshot then you must download the image.
If you have any questions, send an e-mail to the e-mail address at the top of this page.
Read Introducing Player Archetypes on HockeyAnalysis.com for more details on archetype calculations.
Core Archetypes
| Season | Team(s) | GP | TOI | Producer | Playmaker | Shooter | Sniper | Rebound | Rush | Skating | Defend |
|---|---|---|---|---|---|---|---|---|---|---|---|
| 2019-20 | CBJ | 22 | -0.64 | -0.72 | -0.26 | -0.78 | - | -0.88 | - | 1.01 | |
| 2020-21 | CBJ | 11 | -0.10 | 1.06 | -0.83 | -2.02 | - | -0.81 | - | 0.49 | |
| 2021-22 | CBJ | 82 | -1.24 | -0.80 | -1.00 | -1.33 | - | 2.20 | -0.82 | -0.24 | |
| 2022-23 | CBJ | 80 | -1.09 | -1.30 | -0.12 | 1.25 | - | -0.89 | -0.78 | -2.05 | |
| 2023-24 | BOS, CBJ | 38 | 0.34 | 1.35 | -0.84 | -0.25 | - | -1.10 | -0.40 | -0.43 | |
| 2024-25 | BOS | 76 | -0.61 | 0.24 | -0.94 | -1.49 | - | 0.58 | -0.78 | -0.68 | |
| 2025-26 | BOS | 77 | -0.68 | -0.94 | -0.02 | 0.43 | - | 0.27 | -0.87 | -0.33 |
Situational and Secondary Archetypes
| Season | Team(s) | GP | TOI | 5v5 TOI | 5v4 TOI | 4v5 TOI | Possession | Drive | Suppress | Faceoffs |
|---|---|---|---|---|---|---|---|---|---|---|
| 2019-20 | CBJ | 22 | -1.78 | -1.78 | -1.75 | 0.16 | -0.52 | 0.72 | - | |
| 2020-21 | CBJ | 11 | -0.41 | -1.60 | -1.70 | -0.71 | -0.14 | -0.87 | - | |
| 2021-22 | CBJ | 82 | 0.64 | -1.47 | 1.84 | -0.59 | -0.98 | 0.25 | - | |
| 2022-23 | CBJ | 80 | 0.61 | -1.38 | 1.92 | -0.20 | -0.64 | 0.54 | - | |
| 2023-24 | BOS, CBJ | 38 | -1.08 | -1.48 | 0.04 | -0.50 | -0.63 | 0.01 | - | |
| 2024-25 | BOS | 76 | -0.07 | -1.41 | 0.12 | -0.70 | -0.43 | -0.61 | - | |
| 2025-26 | BOS | 77 | 0.19 | -1.48 | 0.37 | -0.57 | -0.64 | -0.23 | - |
5v5 Individual Stats
| Season | Team(s) | GP | TOI | G/60 | A/60 | Pts/60 | xG/60 | GAE/60 | Sh% | xSh% | Sh%AE | %SA Rush | %SA Reb. |
|---|---|---|---|---|---|---|---|---|---|---|---|---|---|
| 2019-20 | CBJ | 22 | 278:37 | 0.22 | 0.43 | 0.65 | 0.29 | -0.08 | 5.00 | 6.79 | -1.79 | 0.00 | 8.82 |
| 2020-21 | CBJ | 11 | 175:06 | 0.00 | 0.69 | 0.69 | 0.07 | -0.07 | 0.00 | 5.01 | -5.01 | 0.00 | 0.00 |
| 2021-22 | CBJ | 82 | 1438:23 | 0.00 | 0.46 | 0.46 | 0.09 | -0.09 | 0.00 | 3.54 | -3.54 | 3.09 | 2.06 |
| 2022-23 | CBJ | 80 | 1382:12 | 0.22 | 0.22 | 0.43 | 0.12 | 0.10 | 6.17 | 3.34 | 2.83 | 0.00 | 2.68 |
| 2023-24 | CBJ | 23 | 308:38 | 0.19 | 1.17 | 1.36 | 0.11 | 0.08 | 4.35 | 2.50 | 1.85 | 0.00 | 0.00 |
| 2023-24 | BOS | 15 | 227:15 | 0.00 | 0.53 | 0.53 | 0.14 | -0.14 | 0.00 | 4.00 | -4.00 | 0.00 | 0.00 |
| 2023-24 | BOS, CBJ | 38 | 535:53 | 0.11 | 0.90 | 1.01 | 0.12 | -0.01 | 2.78 | 3.04 | -0.26 | 0.00 | 0.00 |
| 2024-25 | BOS | 76 | 1226:24 | 0.00 | 0.64 | 0.64 | 0.13 | -0.13 | 0.00 | 3.46 | -3.46 | 0.81 | 1.63 |
| 2025-26 | BOS | 77 | 1256:36 | 0.19 | 0.43 | 0.62 | 0.13 | 0.06 | 5.33 | 3.73 | 1.60 | 0.78 | 2.34 |
5v5 On Ice Stats
| Season | Team(s) | GP | TOI | SAF/60 | GF/60 | xGF/60 | SAA/60 | GA/60 | xGA/60 | GF% | xGF% | xGF Rel | xGA Rel | xGF% Rel |
|---|---|---|---|---|---|---|---|---|---|---|---|---|---|---|
| 2019-20 | CBJ | 22 | 278:37 | 42.21 | 2.37 | 2.21 | 36.82 | 1.94 | 1.90 | 55.00 | 53.80 | -0.30 | -0.41 | 1.66 |
| 2020-21 | CBJ | 11 | 175:06 | 38.38 | 1.71 | 2.09 | 45.92 | 3.08 | 2.56 | 35.71 | 45.04 | -0.10 | -0.09 | -0.34 |
| 2021-22 | CBJ | 82 | 1438:23 | 38.25 | 2.13 | 2.19 | 46.14 | 3.21 | 2.94 | 39.84 | 42.73 | -0.33 | -0.17 | -2.08 |
| 2022-23 | CBJ | 80 | 1382:12 | 37.16 | 1.91 | 2.29 | 47.27 | 3.91 | 2.96 | 32.84 | 43.56 | -0.25 | -0.25 | -0.62 |
| 2023-24 | CBJ | 23 | 308:38 | 39.46 | 3.11 | 1.91 | 45.10 | 3.50 | 3.00 | 47.06 | 38.93 | -0.75 | 0.32 | -10.96 |
| 2023-24 | BOS | 15 | 227:15 | 34.85 | 1.85 | 2.13 | 37.23 | 1.85 | 2.10 | 50.00 | 50.46 | 0.04 | -0.22 | 2.98 |
| 2023-24 | BOS, CBJ | 38 | 535:53 | 37.51 | 2.58 | 2.00 | 41.76 | 2.80 | 2.61 | 47.92 | 43.40 | -0.43 | 0.08 | -5.65 |
| 2024-25 | BOS | 76 | 1226:24 | 36.25 | 1.96 | 2.26 | 42.91 | 2.79 | 2.31 | 41.24 | 49.39 | 0.02 | -0.12 | 1.53 |
| 2025-26 | BOS | 77 | 1256:36 | 39.06 | 1.86 | 2.26 | 41.83 | 2.44 | 2.75 | 43.33 | 45.06 | -0.35 | 0.16 | -5.05 |
NHL Edge Stats
| Skating | Shooting | Zone Time | |||||||||||
|---|---|---|---|---|---|---|---|---|---|---|---|---|---|
| Season | GP | Top Speed | Bursts>20/mi | Avg. Speed | Top Speed | Avg. Speed | %Long Range | %Mid Range | %High Danger | ES DZ% | ES NZ% | ES OZ% | |
| This table is for Basic and Premium subscribers only. To view please login to and/or subscribe to one of our subscription plans. | |||||||||||||
Legend
| Percentile 0-25 | Percentile 25-50 | Percentile 50-75 | Percentile 75-100 |
5v5 Defense Pairs
| Season | Teammate | Team | TOI | GF/60 | GA/60 | GF% | xGF/60 | xGA/60 | xGF% | xGF Rel | xGA Rel | xGF% Rel |
|---|
Glossary
| Type | Statistic | Definition |
|---|---|---|
| Individual | G/60 | Goals Against per 60 minutes. |
| Individual | A/60 | Assists per 60 minutes. |
| Individual | Pts/60 | Points per 60 minutes. |
| Individual | xG/60 | Expected Goals per 60 minutes. |
| Individual | GAE/60 | Goals Above Expected (G/60 - xG/60). |
| Individual | Sh% | Shooting Percentage. |
| Individual | xSh% | Expected Shooting Percentage. |
| Individual | Sh%AE | Shooting percentage above expected (Sh% - xSh%). |
| Individual | %SA Rush | Percentage of shot attempts determined to be on the rush. |
| Individual | %SA Reb. | Percentage of shot attempts determined to be from rebounds. |
| On Ice | SAF/60 | Shot Attempts For per 60 minutes. |
| On Ice | GF/60 | Goals For per 60 minutes. |
| On Ice | xGF/60 | Expected Goals For per 60 minutes. |
| On Ice | SAA/60 | Shot Attempts Against per 60 minutes (lower is better). |
| On Ice | GA/60 | Goals Against per 60 minutes (lower is better). |
| On Ice | xGA/60 | Expected Goals Against per 60 minutes (lower is better). |
| On Ice | GF% | Goals For Percentage = Goals For / (Goals For + Goals Against) |
| On Ice | xGF% | Expected Goals For Percentage = Expected Goals For / (Expected Goals For + Expected Goals Against) |
| On Ice | xGF Rel | xGF/60 when On Ice - xGF/60 when not On Ice. |
| On Ice | xGA Rel | xGA/60 when On Ice - xGA/60 when not On Ice (lower is better). |
| On Ice | xGF% Rel | xGF% when On Ice - xGF% when not On Ice. |
News and Opinions
-
Daily Bean: Massive Offer Sheet; More to Come; Peeke Signs in Utah at Boston Hockey Now (Sat Jul 4, 2026)
-
The returning Boston Bruins could actually help stabilize the defense at Causway Crowd (Fri Jul 3, 2026)
-
Predicting landing spots for 2 key Boston Bruins free agents at Causway Crowd (Wed Jul 1, 2026)
-
Don Sweeney gets warning on potential albatross decision with one Bruins defenseman at Causway Crowd (Sun Jun 21, 2026)
-
NHL insider hints that Bruins GM Don Sweeney is going down a dangerous road in free agency at Causway Crowd (Fri Jun 19, 2026)
-
Maple Leafs’ Top Free Agent Defence Targets This Summer at The Hockey Writers (Tue Jun 16, 2026)
-
Predicting which Bruins free agents stay and which one go this summer at Causway Crowd (Thu Jun 4, 2026)
-
Bruins Report Card: One Surprise, Two Uncertain Futures at Boston Hockey Now (Sat May 30, 2026)
-
Andrew Peeke Adds to Bruins’ Offseason Decisions at Boston Hockey Now (Sun May 17, 2026)
-
How the Connor Murphy trade affects Bruins' Andrew Peeke outlook at Causway Crowd (Tue Mar 3, 2026)
-
Taking stock of Bruins’ top trade chips entering the NHL deadline at Boston.com (Mon Mar 2, 2026)
-
Bruins’ Trade Deadline Questions Begin Internally at The Hockey Writers (Sat Feb 28, 2026)
-
The Bruins' Jonathan Aspirot reason why Andrew Peeke is expendable at trade deadline at Causway Crowd (Thu Feb 26, 2026)
-
Boston Bruins News: Matthew Poitras, Andrew Peeke, Marco Sturm, injured superstar at Causway Crowd (Sun Feb 1, 2026)
-
Recent NHL deal hints at sneaky value in a Bruins Andrew Peeke trade at Causway Crowd (Tue Jan 27, 2026)
-
Insider’s proposed Bruins trade candidate is off the rails at Causway Crowd (Tue Jan 27, 2026)
-
Bruins coach Marco Sturm points the blame for a massive blunder against Canucks at Causway Crowd (Sun Dec 21, 2025)
-
Shaking up the struggling Boston Bruins' line up at Causway Crowd (Fri Oct 24, 2025)
-
Bruins’ Lineup Takeaways From Day 3 of Training Camp at The Hockey Writers (Sat Sep 20, 2025)
-
NHL Rumors: Maple Leafs, Evangelista, Tuch, Chinakhov, and Peeke at NHL Rumors (Tue Sep 16, 2025)
Current Contract
Andrew Peeke signed a $1,000,000 1-year contract with the Utah Mammoth and General Manager Bill Armstrong on July 3, 2026 with an AAV of $1,000,000. This contract will start in 2026-27 and end after the 2026-27 season. In the first season of the contract the cap hit was equivalent to 0.96% of the salary cap.
Standard Contract (UFA) ( ) (0 ratings)
Andrew Peeke signed a $8,250,000 3-year contract with the Columbus Blue Jackets and General Manager Jarmo Kekalainen on September 28, 2022 with an AAV of $2,750,000. This contract will start in 2023-24 and end after the 2025-26 season. In the first season of the contract the cap hit was equivalent to 3.29% of the salary cap.
Standard Contract (RFA) ( ) (0 ratings)
| Season | Age* | Clause | Cap Hit | AAV | Perf. Bonus | Sign. Bonus | Salary | Compensation | Minors Salary | Status | |
|---|---|---|---|---|---|---|---|---|---|---|---|
| 2023-24 | 25 | $2,750,000 | $2,750,000 | - | - | $2,750,000 | $2,750,000 | $2,750,000 | RFA-arb | ||
| 2024-25 | 26 | $2,750,000 | $2,750,000 | - | - | $2,750,000 | $2,750,000 | $2,750,000 | RFA-arb | ||
| 2025-26 | 27 | $2,750,000 | $2,750,000 | - | - | $2,750,000 | $2,750,000 | $2,750,000 | UFA | ||
| Total | - | - | $8,250,000 | $8,250,000 | $8,250,000 |
Andrew Peeke signed a $1,575,000 2-year contract with the Columbus Blue Jackets and General Manager Jarmo Kekalainen on August 9, 2021 with an AAV of $787,500. This contract will start in 2021-22 and end after the 2022-23 season. In the first season of the contract the cap hit was equivalent to 0.97% of the salary cap.
Standard Contract (RFA) ( ) (0 ratings)
| Season | Age* | Clause | Cap Hit | AAV | Perf. Bonus | Sign. Bonus | Salary | Compensation | Minors Salary | Status | |
|---|---|---|---|---|---|---|---|---|---|---|---|
| 2021-22 | 23 | $787,500 | $787,500 | - | - | $750,000 | $750,000 | $825,000 | 10.2(c) | ||
| 2022-23 | 24 | $787,500 | $787,500 | - | - | $825,000 | $825,000 | $825,000 | RFA | ||
| Total | - | - | $1,575,000 | $1,575,000 | $1,650,000 |
Andrew Peeke signed a $2,750,000 3-year contract with the Columbus Blue Jackets and General Manager Jarmo Kekalainen on April 1, 2019 with an AAV of $916,667. This contract will start in 2018-19 and end after the 2020-21 season. In the first season of the contract the cap hit was equivalent to 1.15% of the salary cap.
Entry Level Contract ( ) (0 ratings)
| Season | Age* | Clause | Cap Hit | AAV | Perf. Bonus | Sign. Bonus | Salary | Compensation | Minors Salary | Status | |
|---|---|---|---|---|---|---|---|---|---|---|---|
| 2018-19 | 20 | $916,667 | $1,491,667 | $25,000 | $92,500 | $807,500 | $900,000 | $70,000 | ELC | ||
| 2019-20 | 21 | $916,667 | $1,491,667 | $850,000 | $92,500 | $832,500 | $925,000 | $70,000 | ELC | ||
| 2020-21 | 22 | $916,667 | $1,491,667 | $850,000 | $92,500 | $832,500 | $925,000 | $70,000 | ELC | ||
| Total | $1,725,000 | $277,500 | $2,472,500 | $2,750,000 | $210,000 |
Career Statistics
| Regular Season | Playoffs | |||||||||||||||||||
|---|---|---|---|---|---|---|---|---|---|---|---|---|---|---|---|---|---|---|---|---|
| Season | League | Team | GP | G | A | Pts | +/- | PIM | Shots | Sh% | TOI/G | GP | G | A | Pts | +/- | PIM | Shots | Sh% | TOI/G |
| 2013-14 | High-CT | South Kent | 43 | 3 | 6 | 9 | ||||||||||||||
| 2013-14 | USPHL | Selects Acad. U16 | 28 | 1 | 9 | 10 | 16 | 3 | ||||||||||||
| 2014-15 | High-CT | South Kent | 37 | 7 | 17 | 24 | 17 | |||||||||||||
| 2014-15 | USPHL | Selects Acad. U18 | 28 | 8 | 12 | 20 | 8 | 4 | 1 | 1 | 2 | 2 | ||||||||
| 2015-16 | USA-S17 | Team Forest | 5 | 1 | 3 | 4 | ||||||||||||||
| 2015-16 | WJAC-19 | USA U19 | 5 | 1 | 1 | 2 | 2 | |||||||||||||
| 2015-16 | Hlinka Gretzky Cup | USA U18 | 4 | 0 | 1 | 1 | 4 | |||||||||||||
| 2015-16 | USHL | Green Bay | 56 | 4 | 26 | 30 | +7 | 30 | 88 | 450.0 | 4 | 1 | 1 | 2 | -4 | 2 | 6 | 1,670.0 | ||
| 2016-17 | NCAA | Univ. of Notre Dame | 40 | 4 | 10 | 14 | +10 | 16 | ||||||||||||
| 2017-18 | NCAA | Univ. of Notre Dame | 39 | 5 | 9 | 14 | +12 | 22 | ||||||||||||
| 2017-18 | WJC-20 | USA U20 | 7 | 1 | 1 | 2 | +1 | 2 | ||||||||||||
| 2018-19 | NCAA | Univ. of Notre Dame | 40 | 3 | 21 | 24 | -2 | 24 | ||||||||||||
| 2019-20 | AHL | Cleveland Monsters | 29 | 5 | 11 | 16 | +1 | 6 | ||||||||||||
| 2019-20 | NHL | Columbus Blue Jackets | 22 | 1 | 2 | 3 | +1 | 4 | 23 | 4.3 | 13:51 | |||||||||
| 2020-21 | NHL | Columbus Blue Jackets | 11 | 0 | 3 | 3 | -4 | 4 | 5 | 0.0 | 17:09 | |||||||||
| 2020-21 | AHL | Cleveland Monsters | 7 | 0 | 4 | 4 | +2 | 2 | ||||||||||||
| 2021-22 | NHL | Columbus Blue Jackets | 82 | 2 | 13 | 15 | -14 | 60 | 72 | 2.8 | 21:29 | |||||||||
| 2021-22 | WC | USA | 10 | 0 | 6 | 6 | -1 | 8 | ||||||||||||
| 2022-23 | NHL | Columbus Blue Jackets | 80 | 6 | 7 | 13 | -41 | 22 | 90 | 6.7 | 21:15 | |||||||||
| 2023-24 | NHL | Columbus Blue Jackets | 23 | 1 | 7 | 8 | -2 | 6 | 24 | 4.2 | 15:37 | |||||||||
| 2023-24 | NHL | Boston Bruins | 15 | 0 | 2 | 2 | +1 | 8 | 13 | 0.0 | 17:36 | 6 | 2 | 2 | 0.0 | 14:45 | ||||
| 2024-25 | NHL | Boston Bruins | 76 | 1 | 16 | 17 | -10 | 15 | 80 | 1.2 | 18:36 | |||||||||
| 2024-25 | WC | USA | 10 | 1 | 2 | 3 | +8 | 4 | ||||||||||||
| 2024-25 | International | Team USA | 1 | 0 | 0 | 0 | ||||||||||||||
| 2025-26 | NHL | Boston Bruins | 77 | 5 | 9 | 14 | -12 | 22 | 82 | 6.1 | 19:23 | 6 | 1 | 1 | +2 | 14 | 6 | 0.0 | 19:46 | |
| NHL Career | 386 | 16 | 59 | 75 | -81 | 141 | 389 | 4.1 | 19:23 | 12 | 1 | 1 | +2 | 16 | 8 | 0.0 | 17:15 | |||