
 Nick Seeler
| Position | Left Defense / Right Defense | Current Team | Philadelphia Flyers |
| Shoots | Left | Current Contract | 4 years ($2.7M CapHit) |
| Height | 6'3" | Expires | 2027-28 |
| Weight (lbs) | 197 | Expiry Age (Jun 30) | 35 |
| Age (DOB) | 33 (June 3, 1993) | Expiry Status | UFA |
| Drafted | 2011, Round 5, Overall 131 (MIN) |
| Date | Team | Transaction | |
|---|---|---|---|
| Mar 6, 2024 | Philadelphia Flyers | Signed 4 years @ $2.700M AAV starting in 2024-25 | |
| May 19, 2022 | Philadelphia Flyers | Signed 2 years @ $775K AAV starting in 2022-23 | |
| Jul 28, 2021 | Philadelphia Flyers | Signed 1 year @ $750K AAV starting in 2021-22 | |
| Jul 1, 2018 | Minnesota Wild | Signed 3 years @ $725K AAV starting in 2018-19 | |
| Mar 26, 2016 | Minnesota Wild | Signed to an entry level contract. |
Player Card(s)
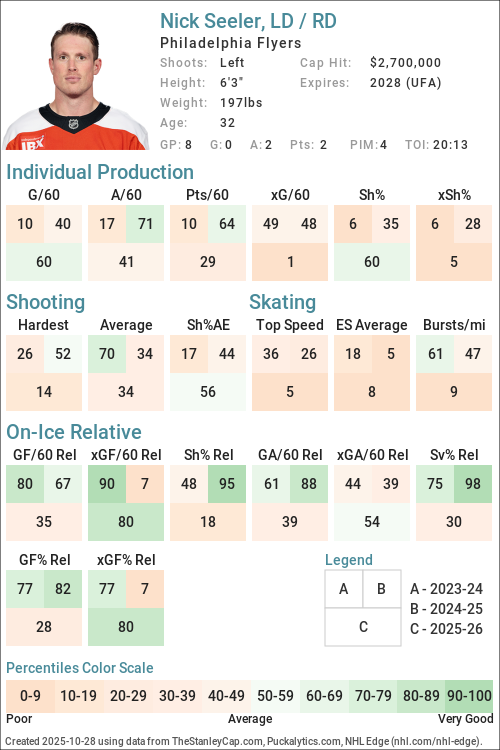
URL: https://thestanleycap.com/cdn/player_cards/20252026/nick-seeler-8476372.png
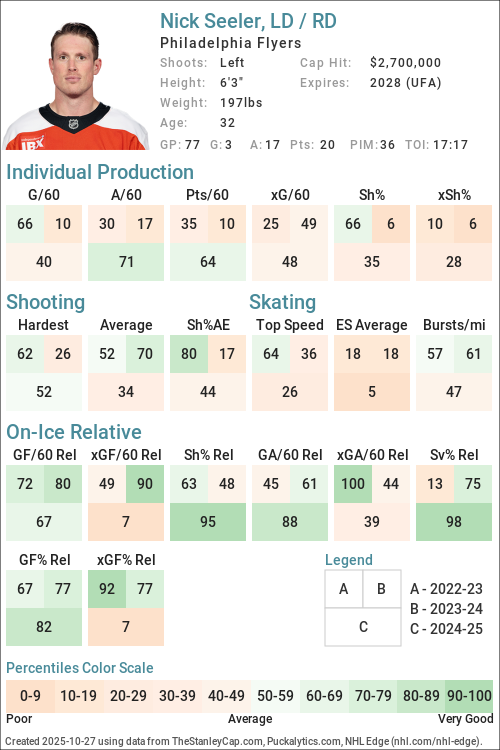
URL: https://thestanleycap.com/cdn/player_cards/20242025/nick-seeler-8476372.png
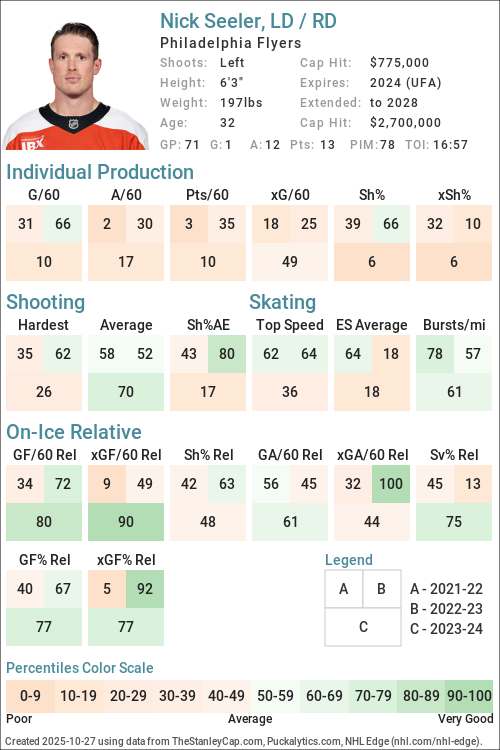
URL: https://thestanleycap.com/cdn/player_cards/20232024/nick-seeler-8476372.png
About Player Cards
Player cards present an infographic of a players performance using a series of Player Archetypes developed for Puckalytics.com and TheStanleyCap.com. The boxes in the rink image show the archetype ratings for the season specified in the card while the graphs to the right show the five-year trends for those archetypes.
Except for Faceoffs, the values shown are the players z-score (standard deviation from the mean) for the specific metric used to calculate the archetype values. When calculating z-scores forwards were compared to forwards and defensemen were compared to defensemen. Positive values indicate the player is above average and shaded in blue, while negative values indicate the player is below average and shaded in pink. The five year trend charts show a range of -4.0 to 4.0.
The value shown for Faceoffs is the faceoff winning percentage rather than their z-score with winning percentages below 50 in pink shades and above 50 in blue shades.
All archetypes are 5v5 except 5v4 TOI, 4v5 TOI, Skating (even strength) and Faceoffs (all situations). Archetypes use regular season data only.
Archetypes Summary
- Sniper - Measures the to score above the expected goal rate.
- Rebound - Measures the percent of a players shot attempts that come from rebounds (forwards only).
- 5v4 TOI - Powerplay ice time, calculated as the percentage of his teams 5v4 ice time that the player was on the ice for.
- Shooter - Measures whether a players points come from shots (goals or assists on rebounds from his shots).
- Producer - Measures a players ability to produce goals and assists, adjusted for quality of teammates.
- Playmaker - Measures whether a players points come from passes.
- Drive - Measures a players ability to drive puck possession and generate shot attempts for his team.
- Rush - Measures the percent of a players shot attempts that come from rush plays
- Possession - An indicator of a players ability to improve his teams puck possession game.
- Faceoffs - Faceoff Winning Percentage (min. 75 faceoffs taken).
- 5v5 TOI - The percentage of his teams 5v5 TOI that the player was on the ice for.
- Suppress - Measures a players ability to suppress opponent puck possession and shot attempts against.
- Skating - An indicator of a players skating ability, or speed bursts above 20mph per mile skated.
- Defend - An indicator of a players ability to suppress shot quality against.
- 4v5 TOI - Penalty Kill ice time, calculated as the percentage of his teams 4v5 ice time that the player was on the ice for.
Data Sources
- Salary data is from TheStanleyCap.com
- Skating data is from NHL Edge
- Other statistics are from Puckalytics.com and derived from data from NHL.com
Terms of Use
You are free to use include player cards in written articles, share on social media, or on other public websites under the following conditions:
- You credit TheStanleyCap.com as the source and provide a link back to TheStanleyCap.com or this player page.
- You do not mass copy/duplicate/publish dozens or hundreds of player cards. A few, or a handful for a written article is fine. Be reasonable. Fair use rules apply.
- If you are a high-traffic website you must download and host the image(s) on your site rather than overload TheStanleyCap servers with traffic.
Note: Player cards will update daily throughout the season so if you want to include snapshot then you must download the image.
If you have any questions, send an e-mail to the e-mail address at the top of this page.
Read Introducing Player Archetypes on HockeyAnalysis.com for more details on archetype calculations.
Core Archetypes
| Season | Team(s) | GP | TOI | Producer | Playmaker | Shooter | Sniper | Rebound | Rush | Skating | Defend |
|---|---|---|---|---|---|---|---|---|---|---|---|
| 2017-18 | MIN | 22 | -0.14 | 1.27 | -1.02 | -1.14 | - | 2.78 | - | 2.77 | |
| 2018-19 | MIN | 71 | -0.87 | -0.87 | -0.51 | 0.06 | - | -1.03 | - | -0.43 | |
| 2019-20 | CHI, MIN | 12 | -0.36 | 0.71 | -0.85 | -4.50 | - | -0.88 | - | -1.60 | |
| 2021-22 | PHI | 43 | -1.45 | -1.65 | -0.52 | -0.13 | - | -1.07 | 0.71 | 0.04 | |
| 2022-23 | PHI | 77 | -0.38 | -0.45 | -0.18 | 0.82 | - | -0.89 | -0.01 | -1.03 | |
| 2023-24 | PHI | 71 | -1.25 | -0.94 | -0.96 | -0.95 | - | -0.37 | 0.05 | 0.67 | |
| 2024-25 | PHI | 77 | 0.06 | 0.44 | -0.52 | 0.16 | - | 1.60 | -0.26 | 1.71 | |
| 2025-26 | PHI | 80 | -1.43 | -1.50 | -0.54 | -0.29 | - | -0.70 | -0.60 | -0.50 |
Situational and Secondary Archetypes
| Season | Team(s) | GP | TOI | 5v5 TOI | 5v4 TOI | 4v5 TOI | Possession | Drive | Suppress | Faceoffs |
|---|---|---|---|---|---|---|---|---|---|---|
| 2017-18 | MIN | 22 | -1.53 | -1.51 | -1.51 | -0.41 | -0.32 | -0.28 | - | |
| 2018-19 | MIN | 71 | -2.72 | -1.71 | -1.29 | -1.10 | -1.94 | 0.53 | - | |
| 2019-20 | CHI, MIN | 12 | -2.17 | -1.74 | -1.46 | -2.68 | -0.77 | -3.70 | - | |
| 2021-22 | PHI | 43 | -2.17 | -1.49 | -1.20 | -0.67 | -1.15 | 0.35 | - | |
| 2022-23 | PHI | 77 | -1.42 | -1.40 | -0.91 | 1.22 | 0.45 | 1.48 | - | |
| 2023-24 | PHI | 71 | -0.84 | -1.41 | 0.20 | 0.74 | 1.91 | -0.76 | - | |
| 2024-25 | PHI | 77 | -0.86 | -1.48 | 0.30 | -1.02 | -0.87 | -0.53 | - | |
| 2025-26 | PHI | 80 | -0.58 | -1.48 | 0.26 | 0.65 | 0.83 | -0.01 | - |
5v5 Individual Stats
| Season | Team(s) | GP | TOI | G/60 | A/60 | Pts/60 | xG/60 | GAE/60 | Sh% | xSh% | Sh%AE | %SA Rush | %SA Reb. |
|---|---|---|---|---|---|---|---|---|---|---|---|---|---|
| 2017-18 | MIN | 22 | 289:40 | 0.00 | 0.83 | 0.83 | 0.09 | -0.09 | 0.00 | 2.60 | -2.60 | 4.35 | 0.00 |
| 2018-19 | MIN | 71 | 784:11 | 0.15 | 0.38 | 0.54 | 0.16 | -0.01 | 3.39 | 3.55 | -0.16 | 0.00 | 2.33 |
| 2019-20 | MIN | 6 | 57:51 | 0.00 | 0.00 | 0.00 | 0.49 | -0.49 | 0.00 | 11.86 | -11.86 | 0.00 | 12.50 |
| 2019-20 | CHI | 6 | 73:59 | 0.00 | 0.81 | 0.81 | 0.03 | -0.03 | 0.00 | 3.70 | -3.70 | 0.00 | 0.00 |
| 2019-20 | CHI, MIN | 12 | 131:50 | 0.00 | 0.46 | 0.46 | 0.23 | -0.23 | 0.00 | 10.23 | -10.23 | 0.00 | 9.09 |
| 2021-22 | PHI | 43 | 516:56 | 0.12 | 0.23 | 0.35 | 0.14 | -0.02 | 3.23 | 3.75 | -0.53 | 0.00 | 2.13 |
| 2022-23 | PHI | 77 | 1025:25 | 0.23 | 0.53 | 0.76 | 0.15 | 0.08 | 5.00 | 3.21 | 1.79 | 0.00 | 6.67 |
| 2023-24 | PHI | 71 | 1016:37 | 0.06 | 0.47 | 0.53 | 0.17 | -0.11 | 1.08 | 3.08 | -2.00 | 0.72 | 6.52 |
| 2024-25 | PHI | 77 | 1167:14 | 0.15 | 0.77 | 0.93 | 0.14 | 0.01 | 3.75 | 3.44 | 0.31 | 1.47 | 3.68 |
| 2025-26 | PHI | 80 | 1208:01 | 0.15 | 0.15 | 0.30 | 0.17 | -0.02 | 3.53 | 4.11 | -0.58 | 0.00 | 3.60 |
5v5 On Ice Stats
| Season | Team(s) | GP | TOI | SAF/60 | GF/60 | xGF/60 | SAA/60 | GA/60 | xGA/60 | GF% | xGF% | xGF Rel | xGA Rel | xGF% Rel |
|---|---|---|---|---|---|---|---|---|---|---|---|---|---|---|
| 2017-18 | MIN | 22 | 289:40 | 40.39 | 2.69 | 2.14 | 39.77 | 1.45 | 1.79 | 65.00 | 54.40 | -0.15 | -0.14 | 0.21 |
| 2018-19 | MIN | 71 | 784:11 | 37.57 | 1.99 | 1.99 | 38.94 | 2.37 | 2.09 | 45.61 | 48.70 | -0.58 | 0.03 | -6.84 |
| 2019-20 | MIN | 6 | 57:51 | 28.00 | 0.00 | 1.29 | 47.71 | 6.22 | 1.65 | 0.00 | 43.82 | -0.66 | -0.67 | -1.81 |
| 2019-20 | CHI | 6 | 73:59 | 42.17 | 1.62 | 2.68 | 59.20 | 3.24 | 4.08 | 33.33 | 39.67 | -0.08 | 1.85 | -15.72 |
| 2019-20 | CHI, MIN | 12 | 131:50 | 35.95 | 0.91 | 2.07 | 54.16 | 4.55 | 3.01 | 16.67 | 40.73 | -0.29 | 0.74 | -10.27 |
| 2021-22 | PHI | 43 | 516:56 | 37.26 | 1.97 | 2.05 | 44.57 | 2.55 | 2.96 | 43.59 | 40.92 | -0.32 | 0.13 | -4.67 |
| 2022-23 | PHI | 77 | 1025:25 | 41.60 | 2.40 | 2.34 | 38.97 | 2.57 | 2.27 | 48.24 | 50.83 | -0.07 | -0.58 | 4.89 |
| 2023-24 | PHI | 71 | 1016:37 | 50.34 | 2.89 | 2.72 | 40.66 | 2.60 | 2.31 | 52.69 | 54.05 | 0.30 | 0.06 | 2.26 |
| 2024-25 | PHI | 77 | 1167:14 | 36.24 | 2.62 | 2.14 | 39.58 | 2.36 | 2.25 | 52.58 | 48.72 | -0.42 | 0.18 | -6.56 |
| 2025-26 | PHI | 80 | 1208:01 | 38.24 | 1.74 | 2.45 | 37.70 | 2.33 | 2.32 | 42.68 | 51.38 | 0.03 | 0.02 | 0.06 |
NHL Edge Stats
| Skating | Shooting | Zone Time | |||||||||||
|---|---|---|---|---|---|---|---|---|---|---|---|---|---|
| Season | GP | Top Speed | Bursts>20/mi | Avg. Speed | Top Speed | Avg. Speed | %Long Range | %Mid Range | %High Danger | ES DZ% | ES NZ% | ES OZ% | |
| This table is for Basic and Premium subscribers only. To view please login to and/or subscribe to one of our subscription plans. | |||||||||||||
Legend
| Percentile 0-25 | Percentile 25-50 | Percentile 50-75 | Percentile 75-100 |
5v5 Defense Pairs
| Season | Teammate | Team | TOI | GF/60 | GA/60 | GF% | xGF/60 | xGA/60 | xGF% | xGF Rel | xGA Rel | xGF% Rel |
|---|
Glossary
| Type | Statistic | Definition |
|---|---|---|
| Individual | G/60 | Goals Against per 60 minutes. |
| Individual | A/60 | Assists per 60 minutes. |
| Individual | Pts/60 | Points per 60 minutes. |
| Individual | xG/60 | Expected Goals per 60 minutes. |
| Individual | GAE/60 | Goals Above Expected (G/60 - xG/60). |
| Individual | Sh% | Shooting Percentage. |
| Individual | xSh% | Expected Shooting Percentage. |
| Individual | Sh%AE | Shooting percentage above expected (Sh% - xSh%). |
| Individual | %SA Rush | Percentage of shot attempts determined to be on the rush. |
| Individual | %SA Reb. | Percentage of shot attempts determined to be from rebounds. |
| On Ice | SAF/60 | Shot Attempts For per 60 minutes. |
| On Ice | GF/60 | Goals For per 60 minutes. |
| On Ice | xGF/60 | Expected Goals For per 60 minutes. |
| On Ice | SAA/60 | Shot Attempts Against per 60 minutes (lower is better). |
| On Ice | GA/60 | Goals Against per 60 minutes (lower is better). |
| On Ice | xGA/60 | Expected Goals Against per 60 minutes (lower is better). |
| On Ice | GF% | Goals For Percentage = Goals For / (Goals For + Goals Against) |
| On Ice | xGF% | Expected Goals For Percentage = Expected Goals For / (Expected Goals For + Expected Goals Against) |
| On Ice | xGF Rel | xGF/60 when On Ice - xGF/60 when not On Ice. |
| On Ice | xGA Rel | xGA/60 when On Ice - xGA/60 when not On Ice (lower is better). |
| On Ice | xGF% Rel | xGF% when On Ice - xGF% when not On Ice. |
News and Opinions
-
Latest report reveals what a Darnell Nurse trade would cost the Flyers at Broad Street Hockey (Tue Jun 30, 2026)
-
Pagnotta: Flyers want Oilers to retain near $3 million in Nurse-Seeler swap at Oilers Nation (Tue Jun 30, 2026)
-
Could these 3 Flyers be buyout candidates this summer? at Broad Street Hockey (Mon Jun 15, 2026)
-
4 Defencemen Who Could Replace Darnell Nurse for the Edmonton Oilers at The Hockey Writers (Sun Jun 14, 2026)
-
2025-26 Player Grades: Nick Seeler filled his role admirably at Broad Street Hockey (Fri Jun 5, 2026)
-
Philadelphia Flyers Best Games of 2025-26: Defensemen at Flyer Nation (Wed Jun 3, 2026)
-
Flyers Report Cards: Seeler, Andrae, & Juulsen, The 3rd Pair Rotation at Philly Hockey Now (Tue May 26, 2026)
-
2025-2026 Philadelphia Flyers Exit Interviews at Flyer Nation (Thu May 14, 2026)
-
Nick Seeler praises Flyers fans “That was the craziest building I’ve ever played in. The fans were fantastic and they brought it tonight” at Flyers Nitty Gritty (Thu Apr 23, 2026)
-
Takeaways: Flyers youngsters lead the way with impressive 4-2 win over stacked Canadiens lineup at Broad Street Hockey (Tue Apr 14, 2026)
-
Takeaways: Flyers steamroll Winnipeg 7-1 to maintain Metro playoff spot at Broad Street Hockey (Sat Apr 11, 2026)
-
Dan Vladar starts tonight for the Flyers, while Travis Konecny and Nick Seeler are game time decisions at Flyers Nitty Gritty (Mon Mar 9, 2026)
-
Travis Konecny, Nick Seeler out injured for Flyers vs. Mammoth at Broad Street Hockey (Thu Mar 5, 2026)
-
Takeaways: Flyers unbeaten in 2026 with 5-2 shutdown victory over high-flying Oilers at Broad Street Hockey (Sat Jan 3, 2026)
-
Flyers Fend Off Oilers Push, Hold on for 5-2 Win on Saturday at Philly Hockey Now (Sat Jan 3, 2026)
-
Flyers Postgame Blog: Bounce-Back Win Powered by Grit & Goaltending at Philly Hockey Now (Wed Dec 31, 2025)
-
On sait maintenant ce qui a provoqué la colère de Brendan Gallagher envers Nick Seeler mardi at HABSolument Fan (Thu Dec 18, 2025)
-
Nick Seeler deserves his flowers for efforts on improved Flyers blue line at Broad Street Hockey (Sun Nov 9, 2025)
-
Jamie Drysdale and Nick Seeler might be key to Flyers success next six weeks and beyond at Broad Street Hockey (Sat Oct 25, 2025)
-
Flyers 2025-26 Season Preview: Can the Flyers continue to maximize their defensive depth? at Broad Street Hockey (Mon Sep 22, 2025)
-
Flyers fans are falling in love with Nick Seeler’s old-school grit at Broad Street Buzz (Mon Aug 25, 2025)
-
Top 5 goals of Flyers 2024-25 season at Broad Street Hockey (Tue Jul 15, 2025)
Current Contract
Nick Seeler signed a $10,800,000 4-year contract with the Philadelphia Flyers and General Manager Daniel Briere on March 6, 2024 with an AAV of $2,700,000. This contract will start in 2024-25 and end after the 2027-28 season. In the first season of the contract the cap hit was equivalent to 3.07% of the salary cap.
Standard Contract (UFA) ( ) (0 ratings)
Nick Seeler signed a $1,550,000 2-year contract with the Philadelphia Flyers and General Manager Chuck Fletcher on May 19, 2022 with an AAV of $775,000. This contract will start in 2022-23 and end after the 2023-24 season. In the first season of the contract the cap hit was equivalent to 0.94% of the salary cap.
Standard Contract (UFA) ( ) (0 ratings)
| Season | Age* | Clause | Cap Hit | AAV | Perf. Bonus | Sign. Bonus | Salary | Compensation | Minors Salary | Status | |
|---|---|---|---|---|---|---|---|---|---|---|---|
| 2022-23 | 29 | $775,000 | $775,000 | - | - | $750,000 | $750,000 | $750,000 | UFA | ||
| 2023-24 | 30 | $775,000 | $775,000 | - | - | $800,000 | $800,000 | $350,000 | UFA | ||
| Total | - | - | $1,550,000 | $1,550,000 | $1,100,000 |
Nick Seeler signed a $750,000 1-year contract with the Philadelphia Flyers and General Manager Chuck Fletcher on July 28, 2021 with an AAV of $750,000. This contract will start in 2021-22 and end after the 2021-22 season. In the first season of the contract the cap hit was equivalent to 0.92% of the salary cap.
Standard Contract (UFA) ( ) (0 ratings)
| Season | Age* | Clause | Cap Hit | AAV | Perf. Bonus | Sign. Bonus | Salary | Compensation | Minors Salary | Status | |
|---|---|---|---|---|---|---|---|---|---|---|---|
| 2021-22 | 28 | $750,000 | $750,000 | - | - | $750,000 | $750,000 | $300,000 | UFA | ||
| Total | - | - | $750,000 | $750,000 | $300,000 |
Nick Seeler signed a $2,175,000 3-year contract with the Minnesota Wild and General Manager Paul Fenton on July 1, 2018 with an AAV of $725,000. This contract will start in 2018-19 and end after the 2020-21 season. In the first season of the contract the cap hit was equivalent to 0.91% of the salary cap. The Chicago Blackhawks terminated this contract on January 17, 2021.
Standard Contract (RFA) ( ) (0 ratings)
| Season | Age* | Clause | Cap Hit | AAV | Perf. Bonus | Sign. Bonus | Salary | Compensation | Minors Salary | Status | |
|---|---|---|---|---|---|---|---|---|---|---|---|
| 2018-19 | 25 | $725,000 | $725,000 | - | - | $675,000 | $675,000 | $675,000 | RFA-arb | ||
| 2019-20 | 26 | $725,000 | $725,000 | - | - | $750,000 | $750,000 | $750,000 | RFA-arb | ||
| 2020-21 | 27 | $725,000 | $725,000 | - | - | $750,000 | $750,000 | $750,000 | UFA | ||
| Total | - | - | $2,175,000 | $2,175,000 | $2,175,000 |
Nick Seeler signed a $1,435,000 2-year contract with the Minnesota Wild and General Manager Chuck Fletcher on March 26, 2016 with an AAV of $717,500. This contract will start in 2016-17 and end after the 2017-18 season. In the first season of the contract the cap hit was equivalent to 0.98% of the salary cap.
Entry Level Contract ( ) (0 ratings)
| Season | Age* | Clause | Cap Hit | AAV | Perf. Bonus | Sign. Bonus | Salary | Compensation | Minors Salary | Status | |
|---|---|---|---|---|---|---|---|---|---|---|---|
| 2016-17 | 23 | $717,500 | $925,000 | $232,500 | $92,500 | $600,000 | $692,500 | $70,000 | ELC | ||
| 2017-18 | 24 | $717,500 | $925,000 | $182,500 | $92,500 | $650,000 | $742,500 | $70,000 | ELC | ||
| Total | $415,000 | $185,000 | $1,250,000 | $1,435,000 | $140,000 |
Career Statistics
| Regular Season | Playoffs | |||||||||||||||||||
|---|---|---|---|---|---|---|---|---|---|---|---|---|---|---|---|---|---|---|---|---|
| Season | League | Team | GP | G | A | Pts | +/- | PIM | Shots | Sh% | TOI/G | GP | G | A | Pts | +/- | PIM | Shots | Sh% | TOI/G |
| 2008-09 | USHS-MN | Eden Prairie High | 17 | 0 | 2 | 2 | 6 | 6 | 2 | |||||||||||
| 2009-10 | High-MN | Eden Prairie | 25 | 3 | 14 | 17 | 12 | 3 | 1 | 3 | 4 | |||||||||
| 2010-11 | High-MN | Eden Prairie | 22 | 7 | 27 | 34 | 38 | 6 | 2 | 7 | 9 | 10 | ||||||||
| 2010-11 | UMHSEL | Southwest | 21 | 3 | 7 | 10 | 32 | 3 | 3 | 3 | 16 | |||||||||
| 2011-12 | USHL | Muskegon | 32 | 2 | 13 | 15 | -8 | 32 | 52 | 385.0 | ||||||||||
| 2011-12 | USHL | Des Moines | 26 | 2 | 11 | 13 | -8 | 33 | 55 | 364.0 | ||||||||||
| 2012-13 | WCHA | Nebraska-Omaha | 34 | 2 | 7 | 9 | 55 | |||||||||||||
| 2013-14 | NCHC | Nebraska-Omaha | 36 | 4 | 6 | 10 | 61 | |||||||||||||
| 2015-16 | NCAA | Univ. of Minnesota | 36 | 0 | 10 | 10 | +21 | 43 | ||||||||||||
| 2016-17 | AHL | Iowa Wild | 57 | 0 | 5 | 5 | -10 | 109 | ||||||||||||
| 2017-18 | AHL | Iowa Wild | 49 | 2 | 10 | 12 | -3 | 74 | ||||||||||||
| 2017-18 | NHL | Minnesota Wild | 22 | 0 | 4 | 4 | +10 | 21 | 17 | 0.0 | 14:32 | 5 | 2 | 2 | +1 | 7 | 5 | 0.0 | 17:23 | |
| 2018-19 | NHL | Minnesota Wild | 71 | 2 | 5 | 7 | -4 | 64 | 67 | 3.0 | 12:20 | |||||||||
| 2019-20 | AHL | Iowa Wild | 6 | 0 | 2 | 2 | +9 | 4 | ||||||||||||
| 2019-20 | NHL | Chicago Blackhawks | 6 | 0 | 1 | 1 | -2 | 7 | 1 | 0.0 | 13:32 | |||||||||
| 2019-20 | NHL | Minnesota Wild | 6 | 0 | 0 | 0 | -6 | 8 | 4 | 0.0 | 10:19 | |||||||||
| 2021-22 | NHL | Philadelphia Flyers | 43 | 1 | 2 | 3 | -3 | 29 | 32 | 3.1 | 13:05 | |||||||||
| 2022-23 | NHL | Philadelphia Flyers | 77 | 4 | 10 | 14 | +1 | 56 | 84 | 4.8 | 14:29 | |||||||||
| 2023-24 | NHL | Philadelphia Flyers | 71 | 1 | 12 | 13 | +9 | 78 | 100 | 1.0 | 16:57 | |||||||||
| 2024-25 | NHL | Philadelphia Flyers | 77 | 3 | 17 | 20 | +10 | 36 | 82 | 3.7 | 17:17 | |||||||||
| 2025-26 | NHL | Philadelphia Flyers | 80 | 4 | 6 | 10 | +1 | 38 | 94 | 4.3 | 17:41 | 10 | 1 | 1 | +1 | 28 | 6 | 16.7 | 15:06 | |
| NHL Career | 453 | 15 | 57 | 72 | +16 | 337 | 481 | 3.1 | 15:23 | 15 | 1 | 2 | 3 | +2 | 35 | 11 | 9.1 | 15:52 | ||