
 Timo Meier
| Position | Left Wing / Right Wing | Current Team | New Jersey Devils |
| Shoots | Left | Current Contract | 8 years ($8.8M CapHit) |
| Height | 6'1" | Expires | 2030-31 |
| Weight (lbs) | 220 | Expiry Age (Jun 30) | 34 |
| Age (DOB) | 29 (Oct 8, 1996) | Expiry Status | UFA |
| Drafted | 2015, Round 1, Overall 9 (SJS) |
| Date | Team | Transaction | |
|---|---|---|---|
| Nov 28, 2024 | New Jersey Devils | Suspension Ended | |
| Nov 26, 2024 | New Jersey Devils | Suspension Started | |
| Jun 28, 2023 | New Jersey Devils | Signed 8 years @ $8.800M AAV starting in 2023-24 | |
| Jul 1, 2019 | San Jose Sharks | Signed 4 years @ $6.000M AAV starting in 2019-20 | |
| Jul 7, 2015 | San Jose Sharks | Signed to an entry level contract. |
Player Card(s)
URL: https://thestanleycap.com/cdn/player_cards/20252026/timo-meier-8478414.png

URL: https://thestanleycap.com/cdn/player_cards/20242025/timo-meier-8478414.png

URL: https://thestanleycap.com/cdn/player_cards/20232024/timo-meier-8478414.png
About Player Cards
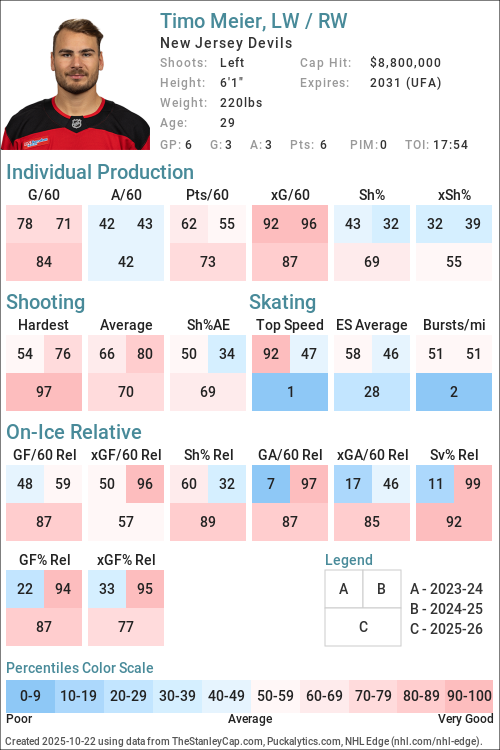
Player cards present an infographic of a players performance using a series of Player Archetypes developed for Puckalytics.com and TheStanleyCap.com. The boxes in the rink image show the archetype ratings for the season specified in the card while the graphs to the right show the five-year trends for those archetypes.
Except for Faceoffs, the values shown are the players z-score (standard deviation from the mean) for the specific metric used to calculate the archetype values. When calculating z-scores forwards were compared to forwards and defensemen were compared to defensemen. Positive values indicate the player is above average and shaded in blue, while negative values indicate the player is below average and shaded in pink. The five year trend charts show a range of -4.0 to 4.0.
The value shown for Faceoffs is the faceoff winning percentage rather than their z-score with winning percentages below 50 in pink shades and above 50 in blue shades.
All archetypes are 5v5 except 5v4 TOI, 4v5 TOI, Skating (even strength) and Faceoffs (all situations). Archetypes use regular season data only.
Archetypes Summary
- Sniper - Measures the to score above the expected goal rate.
- Rebound - Measures the percent of a players shot attempts that come from rebounds (forwards only).
- 5v4 TOI - Powerplay ice time, calculated as the percentage of his teams 5v4 ice time that the player was on the ice for.
- Shooter - Measures whether a players points come from shots (goals or assists on rebounds from his shots).
- Producer - Measures a players ability to produce goals and assists, adjusted for quality of teammates.
- Playmaker - Measures whether a players points come from passes.
- Drive - Measures a players ability to drive puck possession and generate shot attempts for his team.
- Rush - Measures the percent of a players shot attempts that come from rush plays
- Possession - An indicator of a players ability to improve his teams puck possession game.
- Faceoffs - Faceoff Winning Percentage (min. 75 faceoffs taken).
- 5v5 TOI - The percentage of his teams 5v5 TOI that the player was on the ice for.
- Suppress - Measures a players ability to suppress opponent puck possession and shot attempts against.
- Skating - An indicator of a players skating ability, or speed bursts above 20mph per mile skated.
- Defend - An indicator of a players ability to suppress shot quality against.
- 4v5 TOI - Penalty Kill ice time, calculated as the percentage of his teams 4v5 ice time that the player was on the ice for.
Data Sources
- Salary data is from TheStanleyCap.com
- Skating data is from NHL Edge
- Other statistics are from Puckalytics.com and derived from data from NHL.com
Terms of Use
You are free to use include player cards in written articles, share on social media, or on other public websites under the following conditions:
- You credit TheStanleyCap.com as the source and provide a link back to TheStanleyCap.com or this player page.
- You do not mass copy/duplicate/publish dozens or hundreds of player cards. A few, or a handful for a written article is fine. Be reasonable. Fair use rules apply.
- If you are a high-traffic website you must download and host the image(s) on your site rather than overload TheStanleyCap servers with traffic.
Note: Player cards will update daily throughout the season so if you want to include snapshot then you must download the image.
If you have any questions, send an e-mail to the e-mail address at the top of this page.
Read Introducing Player Archetypes on HockeyAnalysis.com for more details on archetype calculations.
Core Archetypes
| Season | Team(s) | GP | TOI | Producer | Playmaker | Shooter | Sniper | Rebound | Rush | Skating | Defend |
|---|---|---|---|---|---|---|---|---|---|---|---|
| 2016-17 | SJS | 34 | -1.22 | -0.87 | -0.74 | -1.46 | 0.20 | 0.27 | - | 2.12 | |
| 2017-18 | SJS | 81 | 0.00 | -0.67 | 0.75 | -0.36 | 0.79 | 0.11 | - | 0.66 | |
| 2018-19 | SJS | 78 | 1.81 | 0.45 | 1.73 | 0.14 | -0.06 | 0.12 | - | -0.15 | |
| 2019-20 | SJS | 70 | 2.06 | 0.24 | 2.36 | 0.10 | 0.11 | 1.04 | - | -1.86 | |
| 2020-21 | SJS | 54 | 0.01 | -0.61 | 0.64 | -0.10 | -1.41 | 1.28 | - | 0.12 | |
| 2021-22 | SJS | 77 | 1.95 | 0.89 | 1.43 | -0.25 | -0.73 | -0.50 | 0.18 | 0.55 | |
| 2022-23 | NJD, SJS | 78 | -0.11 | -1.06 | 1.15 | -0.25 | -0.20 | -0.69 | 0.33 | -0.22 | |
| 2023-24 | NJD | 69 | 0.35 | -0.35 | 0.74 | 0.11 | -0.40 | -0.70 | -0.15 | -1.12 | |
| 2024-25 | NJD | 80 | 0.09 | -0.47 | 0.53 | -0.33 | -0.19 | -0.24 | -0.18 | 2.24 | |
| 2025-26 | NJD | 77 | -0.12 | -0.39 | 0.10 | -0.74 | -0.39 | -0.69 | -0.36 | -0.04 |
Situational and Secondary Archetypes
| Season | Team(s) | GP | TOI | 5v5 TOI | 5v4 TOI | 4v5 TOI | Possession | Drive | Suppress | Faceoffs |
|---|---|---|---|---|---|---|---|---|---|---|
| 2016-17 | SJS | 34 | -0.27 | -1.88 | -1.34 | 1.16 | 1.07 | 0.70 | - | |
| 2017-18 | SJS | 81 | 0.32 | -0.73 | -1.61 | 0.59 | 1.25 | -0.70 | 48.6 | |
| 2018-19 | SJS | 78 | 0.90 | -0.10 | -1.15 | 0.42 | 1.27 | -0.86 | - | |
| 2019-20 | SJS | 70 | 0.89 | 0.31 | -1.06 | 0.84 | 1.02 | -0.02 | - | |
| 2020-21 | SJS | 54 | 0.69 | -0.20 | -2.02 | 0.37 | 0.29 | 0.30 | - | |
| 2021-22 | SJS | 77 | 1.65 | 0.85 | -1.93 | 2.14 | 2.45 | 0.01 | - | |
| 2022-23 | NJD, SJS | 78 | 1.53 | 1.16 | -1.75 | 1.33 | 1.49 | 0.13 | - | |
| 2023-24 | NJD | 69 | 1.19 | 0.27 | -2.01 | -0.37 | 0.01 | -0.76 | 48.9 | |
| 2024-25 | NJD | 80 | 1.48 | 0.12 | -2.11 | 1.34 | 1.76 | -0.32 | - | |
| 2025-26 | NJD | 77 | 1.48 | 0.26 | -1.74 | 1.05 | 1.49 | -0.26 | 45.6 |
5v5 Individual Stats
| Season | Team(s) | GP | TOI | G/60 | A/60 | Pts/60 | xG/60 | GAE/60 | Sh% | xSh% | Sh%AE | %SA Rush | %SA Reb. |
|---|---|---|---|---|---|---|---|---|---|---|---|---|---|
| 2016-17 | SJS | 34 | 392:08 | 0.46 | 0.46 | 0.92 | 1.10 | -0.64 | 3.80 | 9.06 | -5.26 | 4.59 | 5.50 |
| 2017-18 | SJS | 81 | 1037:50 | 0.87 | 0.81 | 1.68 | 0.99 | -0.12 | 8.93 | 10.19 | -1.26 | 4.18 | 6.69 |
| 2018-19 | SJS | 78 | 1069:06 | 1.18 | 1.40 | 2.58 | 1.14 | 0.04 | 10.82 | 10.50 | 0.33 | 4.35 | 5.07 |
| 2019-20 | SJS | 70 | 927:50 | 1.10 | 1.16 | 2.26 | 1.07 | 0.03 | 10.76 | 10.50 | 0.26 | 6.07 | 6.54 |
| 2020-21 | SJS | 54 | 704:32 | 0.85 | 0.77 | 1.62 | 0.88 | -0.03 | 8.55 | 8.86 | -0.31 | 6.47 | 1.76 |
| 2021-22 | SJS | 77 | 1161:28 | 0.98 | 1.60 | 2.58 | 1.10 | -0.12 | 7.98 | 8.97 | -0.99 | 3.03 | 4.24 |
| 2022-23 | SJS | 57 | 876:30 | 1.16 | 0.82 | 1.99 | 1.30 | -0.14 | 9.60 | 10.74 | -1.14 | 2.77 | 6.32 |
| 2022-23 | NJD | 21 | 290:20 | 0.83 | 0.41 | 1.24 | 1.11 | -0.28 | 7.41 | 9.92 | -2.51 | 1.25 | 7.50 |
| 2022-23 | NJD, SJS | 78 | 1166:50 | 1.08 | 0.72 | 1.80 | 1.25 | -0.17 | 9.09 | 10.55 | -1.46 | 2.40 | 6.61 |
| 2023-24 | NJD | 69 | 982:24 | 0.92 | 0.86 | 1.77 | 0.87 | 0.05 | 9.43 | 8.95 | 0.48 | 2.40 | 6.80 |
| 2024-25 | NJD | 80 | 1194:24 | 0.80 | 0.80 | 1.61 | 0.93 | -0.13 | 8.74 | 10.11 | -1.37 | 2.05 | 6.85 |
| 2025-26 | NJD | 77 | 1177:51 | 0.66 | 0.76 | 1.43 | 1.03 | -0.37 | 6.74 | 10.48 | -3.75 | 1.56 | 6.85 |
5v5 On Ice Stats
| Season | Team(s) | GP | TOI | SAF/60 | GF/60 | xGF/60 | SAA/60 | GA/60 | xGA/60 | GF% | xGF% | xGF Rel | xGA Rel | xGF% Rel |
|---|---|---|---|---|---|---|---|---|---|---|---|---|---|---|
| 2016-17 | SJS | 34 | 392:08 | 47.28 | 1.84 | 2.79 | 37.03 | 1.53 | 2.14 | 54.55 | 56.54 | 0.35 | -0.03 | 3.67 |
| 2017-18 | SJS | 81 | 1037:50 | 48.68 | 2.60 | 2.85 | 42.95 | 2.43 | 2.37 | 51.72 | 54.56 | 0.51 | 0.06 | 4.31 |
| 2018-19 | SJS | 78 | 1069:06 | 49.39 | 3.42 | 3.11 | 39.29 | 2.97 | 2.37 | 53.51 | 56.76 | 0.56 | 0.08 | 4.03 |
| 2019-20 | SJS | 70 | 927:50 | 44.36 | 2.46 | 2.80 | 39.77 | 3.62 | 2.64 | 40.43 | 51.50 | 0.52 | 0.23 | 2.92 |
| 2020-21 | SJS | 54 | 704:32 | 41.22 | 2.38 | 2.60 | 42.50 | 2.73 | 2.42 | 46.67 | 51.81 | 0.12 | -0.20 | 3.17 |
| 2021-22 | SJS | 77 | 1161:28 | 47.63 | 3.10 | 2.99 | 43.76 | 2.48 | 2.72 | 55.56 | 52.39 | 1.03 | 0.14 | 9.22 |
| 2022-23 | SJS | 57 | 876:30 | 46.96 | 2.88 | 3.33 | 41.14 | 3.01 | 2.60 | 48.84 | 56.12 | 0.90 | 0.02 | 7.58 |
| 2022-23 | NJD | 21 | 290:20 | 49.60 | 3.31 | 3.29 | 41.75 | 3.31 | 2.73 | 50.00 | 54.70 | 0.01 | 0.27 | -2.48 |
| 2022-23 | NJD, SJS | 78 | 1166:50 | 47.62 | 2.98 | 3.32 | 41.29 | 3.09 | 2.64 | 49.15 | 55.77 | 0.65 | 0.09 | 4.53 |
| 2023-24 | NJD | 69 | 982:24 | 42.81 | 2.50 | 2.52 | 43.61 | 3.54 | 2.73 | 41.41 | 47.99 | -0.07 | 0.31 | -3.69 |
| 2024-25 | NJD | 80 | 1194:24 | 45.86 | 2.36 | 2.71 | 40.74 | 1.66 | 2.30 | 58.75 | 54.04 | 0.51 | -0.00 | 5.24 |
| 2025-26 | NJD | 77 | 1177:51 | 46.81 | 1.99 | 2.88 | 40.14 | 2.90 | 2.61 | 40.62 | 52.45 | 0.53 | 0.03 | 4.72 |
NHL Edge Stats
| Skating | Shooting | Zone Time | |||||||||||
|---|---|---|---|---|---|---|---|---|---|---|---|---|---|
| Season | GP | Top Speed | Bursts>20/mi | Avg. Speed | Top Speed | Avg. Speed | %Long Range | %Mid Range | %High Danger | ES DZ% | ES NZ% | ES OZ% | |
| This table is for Basic and Premium subscribers only. To view please login to and/or subscribe to one of our subscription plans. | |||||||||||||
Legend
| Percentile 0-25 | Percentile 25-50 | Percentile 50-75 | Percentile 75-100 |
5v5 Lines
| Season | Teammate | Teammate | Team | TOI | GF/60 | GA/60 | GF% | xGF/60 | xGA/60 | xGF% | xGF Rel | xGA Rel | xGF% Rel |
|---|
Glossary
| Type | Statistic | Definition |
|---|---|---|
| Individual | G/60 | Goals Against per 60 minutes. |
| Individual | A/60 | Assists per 60 minutes. |
| Individual | Pts/60 | Points per 60 minutes. |
| Individual | xG/60 | Expected Goals per 60 minutes. |
| Individual | GAE/60 | Goals Above Expected (G/60 - xG/60). |
| Individual | Sh% | Shooting Percentage. |
| Individual | xSh% | Expected Shooting Percentage. |
| Individual | Sh%AE | Shooting percentage above expected (Sh% - xSh%). |
| Individual | %SA Rush | Percentage of shot attempts determined to be on the rush. |
| Individual | %SA Reb. | Percentage of shot attempts determined to be from rebounds. |
| On Ice | SAF/60 | Shot Attempts For per 60 minutes. |
| On Ice | GF/60 | Goals For per 60 minutes. |
| On Ice | xGF/60 | Expected Goals For per 60 minutes. |
| On Ice | SAA/60 | Shot Attempts Against per 60 minutes (lower is better). |
| On Ice | GA/60 | Goals Against per 60 minutes (lower is better). |
| On Ice | xGA/60 | Expected Goals Against per 60 minutes (lower is better). |
| On Ice | GF% | Goals For Percentage = Goals For / (Goals For + Goals Against) |
| On Ice | xGF% | Expected Goals For Percentage = Expected Goals For / (Expected Goals For + Expected Goals Against) |
| On Ice | xGF Rel | xGF/60 when On Ice - xGF/60 when not On Ice. |
| On Ice | xGA Rel | xGA/60 when On Ice - xGA/60 when not On Ice (lower is better). |
| On Ice | xGF% Rel | xGF% when On Ice - xGF% when not On Ice. |
News and Opinions
-
Can A Change In Usage Unlock Timo Meier’s Point Production? at All About the Jersey (Mon Jul 27, 2026)
-
Devils News & Rumors: Meier’s Hockey Camp, Potential Shane Wright Trade, and UFA Targets at The Hockey Writers (Mon Jul 13, 2026)
-
Timo Meier: the gift that keeps giving at Blades of Teal (Sat Jul 11, 2026)
-
An Exercise in Analytics: What Would the Ideal Devils Forward Lineup Be? at All About the Jersey (Sat Jul 4, 2026)
-
Sharks Lose Another Piece of the Timo Meier Trade as Mukhamadullin Heads to Oilers at Yahoo Sports NHL (Sat Jul 4, 2026)
-
3 Devils Who Must Be Better in 2026-27 at The Hockey Writers (Sun Jun 14, 2026)
-
Nico Hischier, Timo Meier suffer devastating fate at the hands of a would-be future teammate at Pucks and Pitchforks (Sun May 31, 2026)
-
Timo Meier suspended at the IIHF World Championships for lower-body hit at Pucks and Pitchforks (Sat May 30, 2026)
-
Devils’ Timo Meier Suspended at Worlds at The Hockey Writers (Fri May 29, 2026)
-
Claude Lemieux’s NHL impact still felt in his second career as an agent at Yahoo Sports NHL (Fri May 29, 2026)
-
DAB Report Card: Timo Meier, F at Devils Army (Thu May 14, 2026)
-
New Jersey Devils’ 2025-26 Report Cards: Timo Meier at The Hockey Writers (Wed May 13, 2026)
-
A More Modern Team: How the Devils Can Lean on their Best Players Next Season at All About the Jersey (Sun Apr 26, 2026)
-
Is Timo Meier the Odd Man Out for the New Jersey Devils? at All About the Jersey (Thu Apr 23, 2026)
-
New Jersey Devils' Timo Meier ranked among NHL's worst finishers at Pucks and Pitchforks (Mon Apr 20, 2026)
-
The All About the Jersey Awards for the 2025-26 New Jersey Devils at All About the Jersey (Sun Apr 19, 2026)
-
Timo Meier leads Connor McDavid in this surprising and important statistic at Pucks and Pitchforks (Sat Mar 28, 2026)
-
What’s Up With Timo Meier? at All About the Jersey (Sun Mar 22, 2026)
-
Cody Glass and Arseny Gritsyuk Deserve Massive Role Increases at All About the Jersey (Sat Mar 21, 2026)
-
Red Wings-Devils Tweetcap: Detroit loses Gibson but Shine bright in New Jersey at The Malik Report (Sun Mar 8, 2026)
-
Jack Hughes and Nico Hischier’s Excellent Games Propel Devils Past Rangers, 6-3 at All About the Jersey (Sat Mar 7, 2026)
-
3 Takeaways from Devils’ Gutsy 4-3 Win Over Maple Leafs at The Hockey Writers (Thu Mar 5, 2026)
-
New Jersey Devils’ 3 Stars of February at The Hockey Writers (Sun Mar 1, 2026)
-
Devils Snap Losing Streak With Great Performances in 3-1 Win Over Blues at All About the Jersey (Sat Feb 28, 2026)
-
Devils Snap Losing Streak With Great Performances in 3-1 Win Over Blues at Yahoo Sports NHL (Sat Feb 28, 2026)
-
March Meier shows up a day early as the New Jersey Devils finally win a game at Pucks and Pitchforks (Sat Feb 28, 2026)
-
The New Jersey Devils Might as Well Try Timo Meier on the Right at This Point at All About the Jersey (Thu Feb 19, 2026)
-
Nico Hischier, Timo Meier, Switzerland end their Olympic dream in devastating fashion at Pucks and Pitchforks (Wed Feb 18, 2026)
-
Timo Meier is approaching an Olympic record after another dominant performance at Pucks and Pitchforks (Tue Feb 17, 2026)
-
Timo Meier shines again in Switzerland's OT thriller against Czechia at Pucks and Pitchforks (Sun Feb 15, 2026)
-
Timo Meier scores twice for Switzerland in win over France at Pucks and Pitchforks (Thu Feb 12, 2026)
-
Sheldon Keefe and Jeremy Colliton’s No-Offense Devils Give Up in Must-Win Game, Shut Out 3-0 by Blue Jackets at All About the Jersey (Wed Feb 4, 2026)
-
Devils Snap Five-Game Skid in St. Louis at Devils Army (Sun Feb 1, 2026)
-
Officials Appear to Invent New Rules to Wave Off Game-Tying Goal as Sheldon Keefe and Jeremy Colliton’s No-Offense Devils Lose 4-1 to Senators at All About the Jersey (Sun Feb 1, 2026)
-
New Jersey Devils: Timo Meier is setting up for another "March Meier" explosion at Pucks and Pitchforks (Sat Jan 31, 2026)
-
Takeaways From Last Night’s 4-1 Loss to the Hurricanes at All About the Jersey (Sun Jan 18, 2026)
-
Devils Start the New Year Right With Convincing 4-1 Win Over Mammoth at All About the Jersey (Sat Jan 3, 2026)
-
Hughes Returns, Scores But Devils Lose To Buffalo 3-1 at Devils Army (Mon Dec 22, 2025)
-
Devils Gameday Preview: Hosting the Sabres With Several Players Returning to the Lineup at The Hockey Writers (Sun Dec 21, 2025)
-
Timo Meier's return to the lineup is huge for the New Jersey Devils at Pucks and Pitchforks (Sat Dec 20, 2025)
-
Devils News & Rumors: Deal(s) Hampered by No-Trade Clauses, Jack Return Timeline & More at The Hockey Writers (Sat Dec 20, 2025)
-
Devils Activate Timo Meier, Assign Parent and Addison to AHL at The Hockey Writers (Sat Dec 20, 2025)
-
Devils News & Rumors: Quinn Returning to NJ, Meier Absence, Ryan O’Reilly at The Hockey Writers (Fri Dec 12, 2025)
-
Well Wishes to Timo Meier — and Devils Injury News at All About the Jersey (Fri Dec 12, 2025)
-
Devils' Meier taking leave for family health matter at ESPN (Thu Dec 11, 2025)
-
Devils’ Timo Meier taking a leave of absence to attend to a family health matter at NBC Sports (Thu Dec 11, 2025)
-
Devils’ Meier Takes Leave of Absence, Dadonov on IR at The Hockey Writers (Thu Dec 11, 2025)
-
Devils Star Timo Meier Takes Personal Leave Of Absence at The Hockey News (Thu Dec 11, 2025)
-
Devils Gameday Preview: Hoping to Score in Boston vs. Bruins at The Hockey Writers (Sat Dec 6, 2025)
-
New Jersey Devils’ 3 Stars of November at The Hockey Writers (Mon Dec 1, 2025)
-
The November 2025 Month in Review of the New Jersey Devils at All About the Jersey (Sun Nov 30, 2025)
-
Devils’ Late Comeback Falters, Fall 5-3 To Flyers at Devils Army (Sun Nov 30, 2025)
-
2015 NHL Draft Top 10: Where Are They Now? at The Hockey Writers (Sat Nov 29, 2025)
-
Finding Wins: Simon Nemec Scores Overtime Goal to Deliver 3-2 Devils Win Over Blues at All About the Jersey (Thu Nov 27, 2025)
-
Devils Look to Stay Hot At Home Against Blues at Devils Army (Wed Nov 26, 2025)
-
A Breakdown of Every Trade Tom Fitzgerald Has Made Since Becoming Devils General Manager at All About the Jersey (Wed Nov 19, 2025)
-
Jake Allen Dominant in Goal in 2-1 Devils Shootout Win Over Penguins at All About the Jersey (Sat Nov 8, 2025)
-
Timo Meier, Jesper Bratt Power New Jersey Devils To 4-3 Overtime Win Over Montreal Canadiens at All About the Jersey (Fri Nov 7, 2025)
-
New Jersey Devils Survive Avalanche With Jack Hughes Overtime Winner, Securing 4-3 Victory at All About the Jersey (Sun Oct 26, 2025)
-
Nico Hischier, Timo Meier, and Dawson Mercer Vs. Elite Competition: A Look At The Numbers at All About the Jersey (Mon Oct 20, 2025)
-
Devils Gameday Preview: Hosting the Oilers for a Weekend Matinee Matchup at The Hockey Writers (Sat Oct 18, 2025)
-
Game Preview #5: New Jersey Devils vs. Edmonton Oilers at All About the Jersey (Sat Oct 18, 2025)
-
3 Devils Forwards Poised to Take a Step Forward in 2025-26 at The Hockey Writers (Wed Oct 15, 2025)
-
Goaltending, Special Teams Lift New Jersey Devils to 3-2 Win Over Columbus Blue Jackets at All About the Jersey (Mon Oct 13, 2025)
-
3 Takeaways from the Devils’ Gutsy 3-2 Victory in Columbus at The Hockey Writers (Mon Oct 13, 2025)
-
Devils Takeaways: Bully Meier; Gritsyuk & Brown Dazzle; Markstrom Concern at New Jersey Hockey Now (Sat Oct 11, 2025)
-
Weak Start, Good Fight, Disastrous Finish: Devils Drop Opener 6-3 to Hurricanes With Three Late Goals Against at All About the Jersey (Fri Oct 10, 2025)
-
New Jersey Devils 2025-26 Season Preview Part 2: Forwards at All About the Jersey (Wed Oct 1, 2025)
-
Kurashev Happy for Fresh Start, Shares What Timo Meier Told Him About San Jose at San Jose Hockey Now (Sun Sep 28, 2025)
-
Here’s What The Rest Of The League Thinks Of The Devils’ Core at All About the Jersey (Mon Sep 15, 2025)
-
Devils 2025-26 Player Previews: Timo Meier at The Hockey Writers (Thu Sep 4, 2025)
-
Is it possible for Timo Meier to be "March Timo" for an entire New Jersey Devils season? at Pucks and Pitchforks (Thu Aug 28, 2025)
-
New Jersey Devils fans believe Timo Meier's resurgence as a goal scorer is most important to the team at Pucks and Pitchforks (Wed Aug 20, 2025)
-
If He Struggles Again in 2025-26, Should the New Jersey Devils Consider Moving on From Timo Meier? at All About the Jersey (Thu Aug 14, 2025)
-
Timo Meier’s Devils Tenure: Inconsistency, Growth, and Future Potential at The Hockey Writers (Tue Aug 12, 2025)
-
Devils Need Meier & Hughes Chemistry to Maximize Success at The Hockey Writers (Thu Jul 31, 2025)
-
It's surprisingly hard to find Stefan Noesen's role for New Jersey Devils at Pucks and Pitchforks (Tue Jul 29, 2025)
-
Setting Goals: Establishing Expectations In Goal Scoring For The New Jersey Devils at All About the Jersey (Mon Jul 28, 2025)
-
Where Can the Devils Get Enough Offense to Make Them Contenders? at All About the Jersey (Sun Jul 20, 2025)
-
Timo Meier is the last trace of the Blake Coleman trade after Nolan Foote decision at Pucks and Pitchforks (Tue Jul 1, 2025)
-
2024-25 Final Player Grades: Forwards; Part II at Devils Army (Tue May 13, 2025)
-
Special Teams Doom Devils To 3-1 Series Deficit at Devils Army (Mon Apr 28, 2025)
-
Devils Return Home for Crucial Game 3 Against The Hurricanes at Devils Army (Fri Apr 25, 2025)
-
Jake Allen Carries Devils To Vital 2-1 Victory In Columbus at Devils Army (Tue Mar 18, 2025)
-
Devils Net Massive Two Points Against Blue Jackets at Devils Army (Wed Mar 12, 2025)
-
Devils Bounce Back With Gutsy Shootout Win In Pittsburgh at Devils Army (Wed Feb 5, 2025)
-
Devils Extract Revenge, Notch Dominating 5-0 Victory at Devils Army (Thu Jan 30, 2025)
-
Tempers Flare in 5-2 Loss to Carolina at Devils Army (Sun Dec 29, 2024)
-
Devils Rally To Beat Red Wings 5-4 on Black Friday at Devils Army (Fri Nov 29, 2024)
-
Meier-Less Devils Eye Fourth-Straight Win Against Blues at Devils Army (Wed Nov 27, 2024)
-
Hischier Hat Trick Propels Surging Devils Past Predators at Devils Army (Tue Nov 26, 2024)
-
Analyzing Every Tom Fitzgerald Trade Part II; 2021-2023 at Devils Army (Tue Oct 29, 2024)
-
Devils Suffer First Loss Of Season; 4-2 In Home Opener at Devils Army (Fri Oct 11, 2024)
-
Specific Predictions for the New Jersey Devils in 2024-25 at Devils Army (Thu Oct 10, 2024)
-
Four Questions for the Devils Entering 2024-25 at Devils Army (Thu Sep 19, 2024)
-
Devils Shutout Islanders in Metropolitan Division Showdown at Devils Army (Mon Mar 25, 2024)
-
Devils Win Convincingly, 5-2, Over Penguins at Devils Army (Wed Mar 20, 2024)
-
Devils Cross Hudson For First Time This Season To Face Rangers at Devils Army (Mon Mar 11, 2024)
-
Timo Meier’s Hat Trick Propels Devils Past Blues at Devils Army (Fri Mar 8, 2024)
-
Costly Losses Piling Up, Devils Drop Road Trip Finale at Devils Army (Sun Mar 3, 2024)
-
Tyler Toffoli’s Hat Trick Leads Devils to 6-5 Thriller Over Vegas at Devils Army (Tue Jan 23, 2024)
-
Devils Return Home, Host Canadiens as Meier Returns at Devils Army (Wed Jan 17, 2024)
-
Devils Kick Off Post Christmas Break Against Columbus at Devils Army (Wed Dec 27, 2023)
-
Devils Continue Road Trip Against St. Louis Blues at Devils Army (Fri Nov 3, 2023)
-
Analyzing The Timo Meier Extension And The Devils’ Cap Situation at Devils Army (Thu Jun 29, 2023)
-
Breaking Down Every Single Devils’ Restricted Free Agent at Devils Army (Thu Jun 8, 2023)
-
Setting The Stage For The New Jersey Devils’ 2023 Offseason at Devils Army (Wed May 31, 2023)
-
Analyzing Tom Fitzgerald’s End-Of-The-Year Press Conference at Devils Army (Thu May 18, 2023)
-
Recapping The New Jersey Devils’ Exit Interview Day at Devils Army (Tue May 16, 2023)
-
Devils Dominated in Game 4 Loss, On Brink Of Elimination at Devils Army (Wed May 10, 2023)
-
Devils Set To Kick Off Second Round In Carolina at Devils Army (Wed May 3, 2023)
-
Devils Thrash Rangers in Pivotal Game Five, Take 3-2 Series Lead at Devils Army (Fri Apr 28, 2023)
-
Devils Halted By History-Making Bruins 2-1 at Devils Army (Sun Apr 9, 2023)
-
Devils Obliterate Columbus 8-1 At The Prudential Center at Devils Army (Fri Apr 7, 2023)
-
Devils Dominate Penguins 5-1, Sweep Season Series at Devils Army (Wed Apr 5, 2023)
-
Devils Turn In All-Around Effort In Vital 2-1 Win Over Rangers at Devils Army (Fri Mar 31, 2023)
-
Devils Fail to Capture Second Point Against Lightning at Devils Army (Fri Mar 17, 2023)
-
Devils Tally Well-Deserved Win In Shootout Over Capitals at Devils Army (Fri Mar 10, 2023)
-
Timo Meier Scores In Overtime Victory Against Arizona at Devils Army (Mon Mar 6, 2023)
-
With A Potential Meier Return Looming, Devils Take On Arizona at Devils Army (Sun Mar 5, 2023)
-
Deadline Targets The Devils Should Focus On Post Timo Meier at Devils Army (Thu Mar 2, 2023)
-
Devils Make A Splash, Get Timo Meier From Sharks In Mega-Deal at Devils Army (Mon Feb 27, 2023)
-
DAB Trade Profile: Brock Boeser, Strong Offensive Top-Six Wing at Devils Army (Tue Feb 14, 2023)
-
DAB Trade Profile: Timo Meier, Top-Line Winger at Devils Army (Fri Jan 27, 2023)
Current Contract
Timo Meier signed an $70,400,000 8-year contract with the New Jersey Devils and General Manager Tom Fitzgerald on June 28, 2023 with an AAV of $8,800,000. This contract will start in 2023-24 and end after the 2030-31 season. In the first season of the contract the cap hit was equivalent to 10.54% of the salary cap.
Standard Contract (RFA) ( ) (0 ratings)
Timo Meier signed a $24,000,000 4-year contract with the San Jose Sharks and General Manager Doug Wilson on July 1, 2019 with an AAV of $6,000,000. This contract will start in 2019-20 and end after the 2022-23 season. In the first season of the contract the cap hit was equivalent to 7.36% of the salary cap.
Standard Contract (RFA) ( ) (0 ratings)
| Season | Age* | Clause | Cap Hit | AAV | Perf. Bonus | Sign. Bonus | Salary | Compensation | Minors Salary | Status | |
|---|---|---|---|---|---|---|---|---|---|---|---|
| 2019-20 | 22 | $6,000,000 | $6,000,000 | - | $3,300,000 | $700,000 | $4,000,000 | $4,000,000 | RFA | ||
| 2020-21 | 23 | $6,000,000 | $6,000,000 | - | $3,300,000 | $700,000 | $4,000,000 | $4,000,000 | RFA-arb | ||
| 2021-22 | 24 | $6,000,000 | $6,000,000 | - | $2,000,000 | $4,000,000 | $6,000,000 | $6,000,000 | RFA-arb | ||
| 2022-23 | 25 | $6,000,000 | $6,000,000 | - | - | $10,000,000 | $10,000,000 | $10,000,000 | RFA-arb | ||
| Total | - | $8,600,000 | $15,400,000 | $24,000,000 | $24,000,000 |
Timo Meier signed a $2,775,000 3-year contract with the San Jose Sharks and General Manager Doug Wilson on July 7, 2015 with an AAV of $925,000. This contract will start in 2015-16 and end after the 2018-19 season. In the first season of the contract the cap hit was equivalent to 1.30% of the salary cap.
Entry Level Contract ( ) (0 ratings)
| Season | Age* | Clause | Cap Hit | AAV | Perf. Bonus | Sign. Bonus | Salary | Compensation | Minors Salary | Status | |
|---|---|---|---|---|---|---|---|---|---|---|---|
| 2015-16 | 18 | $925,000 | $1,675,000 | - | $92,500 | - | $92,500 | - | ELC | ||
| 2016-17 | 19 | $894,167 | $1,644,167 | $650,000 | $92,500 | $832,500 | $925,000 | $70,000 | ELC | ||
| 2017-18 | 20 | $894,167 | $1,644,167 | $750,000 | $92,500 | $832,500 | $925,000 | $70,000 | ELC | ||
| 2018-19 | 21 | $894,167 | $1,644,167 | $850,000 | - | $832,500 | $832,500 | $70,000 | ELC | ||
| Total | $2,250,000 | $277,500 | $2,497,500 | $2,775,000 | $210,000 |
Career Statistics
| Regular Season | Playoffs | |||||||||||||||||||
|---|---|---|---|---|---|---|---|---|---|---|---|---|---|---|---|---|---|---|---|---|
| Season | League | Team | GP | G | A | Pts | +/- | PIM | Shots | Sh% | TOI/G | GP | G | A | Pts | +/- | PIM | Shots | Sh% | TOI/G |
| 2006-07 | Mini A | Herisau U15 | 8 | 7 | 1 | 8 | 4 | |||||||||||||
| 2007-08 | Mini A | Herisau U15 | 9 | 13 | 7 | 20 | 18 | |||||||||||||
| 2008-09 | Mini A | Herisau U15 | 15 | 34 | 22 | 56 | 26 | |||||||||||||
| 2009-10 | Top Novizen | Herisau U17 | 20 | 15 | 9 | 24 | 18 | |||||||||||||
| 2010-11 | Elite Novizen | Pikes Oberthurgau U17 | 23 | 7 | 2 | 9 | 8 | |||||||||||||
| 2010-11 | U17-Elit | Pikes Oberthurgau U17 | 2 | 2 | ||||||||||||||||
| 2011-12 | Swiss-6 | Pikes II | 1 | 2 | 2 | 4 | ||||||||||||||
| 2011-12 | Swiss-U17 | Pikes U17 | 29 | 23 | 23 | 46 | 22 | 10 | 10 | 6 | 16 | 8 | ||||||||
| 2012-13 | Swiss-Jr. | Rapperswil Jr. | 39 | 16 | 22 | 38 | 60 | |||||||||||||
| 2012-13 | Swiss-U17 | Rapperswil U17 | 10 | 11 | 17 | 28 | 2 | 2 | 1 | 2 | 3 | |||||||||
| 2013-14 | QMJHL | Halifax | 66 | 17 | 17 | 34 | +10 | 48 | 187 | 910.0 | 12 | 1 | 3 | 4 | +1 | 8 | 35 | 290.0 | ||
| 2014-15 | QMJHL | Halifax | 61 | 44 | 46 | 90 | +20 | 59 | 316 | 1,390.0 | 14 | 10 | 11 | 21 | +1 | 18 | 96 | 1,040.0 | ||
| 2015-16 | QMJHL | Halifax | 23 | 11 | 25 | 36 | +7 | 22 | ||||||||||||
| 2015-16 | WJC-20 | Switzerland U20 | 6 | 2 | 3 | 5 | -4 | 4 | ||||||||||||
| 2015-16 | M-Cup | Rouyn-Noranda Huskies | 5 | 5 | 3 | 8 | +1 | 6 | ||||||||||||
| 2015-16 | QMJHL | Rouyn-Noranda | 29 | 23 | 28 | 51 | +22 | 24 | 18 | 11 | 12 | 23 | +11 | 30 | ||||||
| 2016-17 | AHL | San Jose Barracuda | 33 | 14 | 9 | 23 | +9 | 40 | 14 | 4 | 3 | 7 | +2 | 41 | ||||||
| 2016-17 | NHL | San Jose Sharks | 34 | 3 | 3 | 6 | +1 | 10 | 85 | 3.5 | 12:28 | 5 | 2 | 11 | 0.0 | 12:04 | ||||
| 2017-18 | WC | Switzerland | 7 | 2 | 5 | 7 | +1 | 2 | ||||||||||||
| 2017-18 | NHL | San Jose Sharks | 81 | 21 | 15 | 36 | +2 | 51 | 210 | 10.0 | 14:52 | 10 | 2 | 3 | 5 | -1 | 10 | 29 | 6.9 | 15:08 |
| 2018-19 | NHL | San Jose Sharks | 78 | 30 | 36 | 66 | +9 | 55 | 250 | 12.0 | 16:58 | 20 | 5 | 10 | 15 | +3 | 34 | 54 | 9.3 | 17:06 |
| 2019-20 | NHL | San Jose Sharks | 70 | 22 | 27 | 49 | -22 | 42 | 199 | 11.1 | 17:17 | |||||||||
| 2020-21 | NHL | San Jose Sharks | 54 | 12 | 19 | 31 | -5 | 22 | 155 | 7.7 | 16:03 | |||||||||
| 2020-21 | WC | Switzerland | 8 | 4 | 2 | 6 | -1 | 6 | ||||||||||||
| 2021-22 | NHL | San Jose Sharks | 77 | 35 | 41 | 76 | -3 | 54 | 326 | 10.7 | 19:09 | |||||||||
| 2021-22 | WC | Switzerland | 8 | 3 | 5 | 8 | +1 | 9 | ||||||||||||
| 2021-22 | EHT | Switzerland | 1 | 1 | 1 | 2 | +1 | |||||||||||||
| 2022-23 | NHL | San Jose Sharks | 57 | 31 | 21 | 52 | -19 | 25 | 255 | 12.2 | 19:59 | |||||||||
| 2022-23 | NHL | New Jersey Devils | 21 | 9 | 5 | 14 | 18 | 72 | 12.5 | 17:47 | 11 | 2 | 2 | 4 | -1 | 22 | 37 | 5.4 | 16:52 | |
| 2023-24 | NHL | New Jersey Devils | 69 | 28 | 24 | 52 | -28 | 45 | 207 | 13.5 | 17:36 | |||||||||
| 2024-25 | WC | Switzerland | 10 | 3 | 7 | 10 | +11 | 4 | ||||||||||||
| 2024-25 | NHL | New Jersey Devils | 80 | 26 | 27 | 53 | +7 | 58 | 239 | 10.9 | 17:52 | 5 | 2 | 2 | 4 | -1 | 6 | 18 | 11.1 | 21:49 |
| 2025-26 | NHL | New Jersey Devils | 77 | 24 | 20 | 44 | -16 | 22 | 269 | 8.9 | 18:31 | |||||||||
| 2025-26 | OG | Switzerland | 5 | 3 | 4 | 7 | +6 | 21 | 14.0 | 18:33 | ||||||||||
| NHL Career | 698 | 241 | 238 | 479 | -74 | 402 | 2267 | 10.6 | 17:19 | 51 | 11 | 17 | 28 | 74 | 149 | 7.4 | 16:38 | |||