
 Dawson Mercer
| Position | Right Wing / Center | Current Team | New Jersey Devils |
| Shoots | Right | Current Contract | 3 years ($4.0M CapHit) |
| Height | 6'0" | Expires | 2026-27 |
| Weight (lbs) | 180 | Expiry Age (Jun 30) | 25 |
| Age (DOB) | 24 (Oct 27, 2001) | Expiry Status | RFA-arb |
| Drafted | 2020, Round 1, Overall 18 (NJD) |
| Date | Team | Transaction | |
|---|---|---|---|
| Sep 20, 2024 | New Jersey Devils | Signed 3 years @ $4.000M AAV starting in 2024-25 | |
| Dec 24, 2020 | New Jersey Devils | Signed to an entry level contract. |
Player Card(s)
URL: https://thestanleycap.com/cdn/player_cards/20252026/dawson-mercer-8482110.png
URL: https://thestanleycap.com/cdn/player_cards/20242025/dawson-mercer-8482110.png
URL: https://thestanleycap.com/cdn/player_cards/20232024/dawson-mercer-8482110.png
About Player Cards
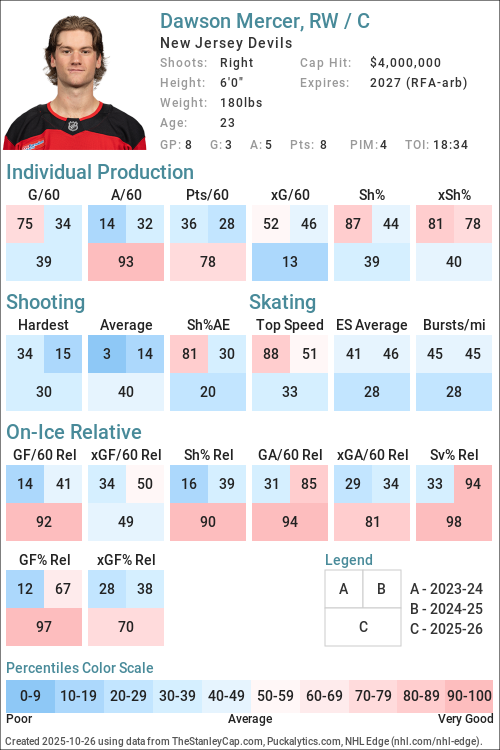
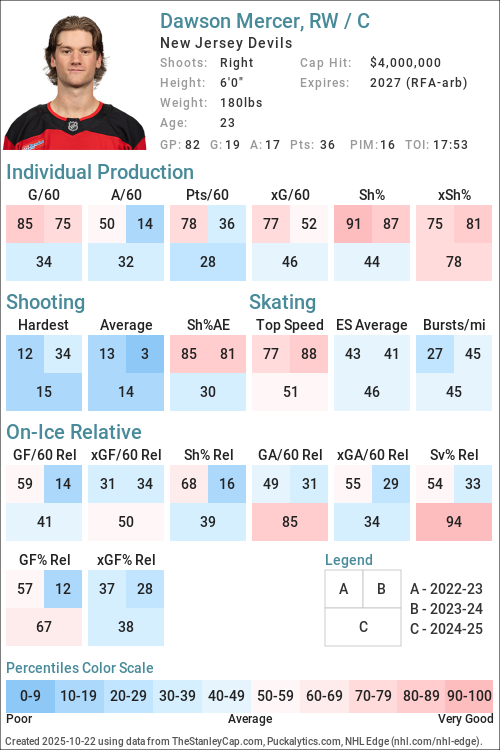
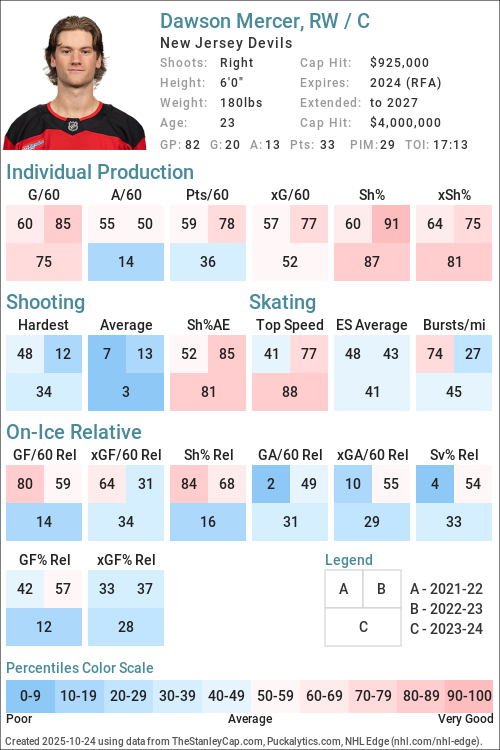
Player cards present an infographic of a players performance using a series of Player Archetypes developed for Puckalytics.com and TheStanleyCap.com. The boxes in the rink image show the archetype ratings for the season specified in the card while the graphs to the right show the five-year trends for those archetypes.
Except for Faceoffs, the values shown are the players z-score (standard deviation from the mean) for the specific metric used to calculate the archetype values. When calculating z-scores forwards were compared to forwards and defensemen were compared to defensemen. Positive values indicate the player is above average and shaded in blue, while negative values indicate the player is below average and shaded in pink. The five year trend charts show a range of -4.0 to 4.0.
The value shown for Faceoffs is the faceoff winning percentage rather than their z-score with winning percentages below 50 in pink shades and above 50 in blue shades.
All archetypes are 5v5 except 5v4 TOI, 4v5 TOI, Skating (even strength) and Faceoffs (all situations). Archetypes use regular season data only.
Archetypes Summary
- Sniper - Measures the to score above the expected goal rate.
- Rebound - Measures the percent of a players shot attempts that come from rebounds (forwards only).
- 5v4 TOI - Powerplay ice time, calculated as the percentage of his teams 5v4 ice time that the player was on the ice for.
- Shooter - Measures whether a players points come from shots (goals or assists on rebounds from his shots).
- Producer - Measures a players ability to produce goals and assists, adjusted for quality of teammates.
- Playmaker - Measures whether a players points come from passes.
- Drive - Measures a players ability to drive puck possession and generate shot attempts for his team.
- Rush - Measures the percent of a players shot attempts that come from rush plays
- Possession - An indicator of a players ability to improve his teams puck possession game.
- Faceoffs - Faceoff Winning Percentage (min. 75 faceoffs taken).
- 5v5 TOI - The percentage of his teams 5v5 TOI that the player was on the ice for.
- Suppress - Measures a players ability to suppress opponent puck possession and shot attempts against.
- Skating - An indicator of a players skating ability, or speed bursts above 20mph per mile skated.
- Defend - An indicator of a players ability to suppress shot quality against.
- 4v5 TOI - Penalty Kill ice time, calculated as the percentage of his teams 4v5 ice time that the player was on the ice for.
Data Sources
- Salary data is from TheStanleyCap.com
- Skating data is from NHL Edge
- Other statistics are from Puckalytics.com and derived from data from NHL.com
Terms of Use
You are free to use include player cards in written articles, share on social media, or on other public websites under the following conditions:
- You credit TheStanleyCap.com as the source and provide a link back to TheStanleyCap.com or this player page.
- You do not mass copy/duplicate/publish dozens or hundreds of player cards. A few, or a handful for a written article is fine. Be reasonable. Fair use rules apply.
- If you are a high-traffic website you must download and host the image(s) on your site rather than overload TheStanleyCap servers with traffic.
Note: Player cards will update daily throughout the season so if you want to include snapshot then you must download the image.
If you have any questions, send an e-mail to the e-mail address at the top of this page.
Read Introducing Player Archetypes on HockeyAnalysis.com for more details on archetype calculations.
Core Archetypes
| Season | Team(s) | GP | TOI | Producer | Playmaker | Shooter | Sniper | Rebound | Rush | Skating | Defend |
|---|---|---|---|---|---|---|---|---|---|---|---|
| 2021-22 | NJD | 82 | -0.37 | -0.42 | -0.25 | -0.08 | -1.16 | -0.14 | 0.56 | -1.79 | |
| 2022-23 | NJD | 82 | 0.55 | -0.38 | 1.05 | 0.81 | 1.37 | -0.16 | -0.67 | 0.08 | |
| 2023-24 | NJD | 82 | -0.25 | -1.01 | 0.81 | 0.66 | 1.56 | -0.24 | -0.32 | -0.39 | |
| 2024-25 | NJD | 82 | -0.68 | -0.56 | -0.46 | -0.48 | -0.02 | 0.16 | -0.32 | 1.55 | |
| 2025-26 | NJD | 82 | -0.43 | 0.28 | -0.85 | -1.12 | -0.10 | -1.31 | -0.65 | 0.81 |
Situational and Secondary Archetypes
| Season | Team(s) | GP | TOI | 5v5 TOI | 5v4 TOI | 4v5 TOI | Possession | Drive | Suppress | Faceoffs |
|---|---|---|---|---|---|---|---|---|---|---|
| 2021-22 | NJD | 82 | 0.66 | 0.01 | -1.49 | -0.41 | 0.09 | -1.02 | 35.4 | |
| 2022-23 | NJD | 82 | 0.47 | -0.48 | 0.08 | -0.94 | -0.94 | -0.34 | 42.4 | |
| 2023-24 | NJD | 82 | 0.70 | -0.48 | 0.63 | -0.66 | -0.56 | -0.39 | 44.9 | |
| 2024-25 | NJD | 82 | 0.63 | -0.21 | 0.97 | -0.59 | -0.11 | -0.88 | 40.5 | |
| 2025-26 | NJD | 82 | 0.82 | -0.13 | 0.78 | 0.62 | 0.74 | -0.02 | 38.9 |
5v5 Individual Stats
| Season | Team(s) | GP | TOI | G/60 | A/60 | Pts/60 | xG/60 | GAE/60 | Sh% | xSh% | Sh%AE | %SA Rush | %SA Reb. |
|---|---|---|---|---|---|---|---|---|---|---|---|---|---|
| 2021-22 | NJD | 82 | 1099:36 | 0.76 | 0.98 | 1.75 | 0.79 | -0.02 | 10.94 | 11.28 | -0.34 | 3.75 | 3.12 |
| 2022-23 | NJD | 82 | 1070:28 | 1.12 | 0.95 | 2.07 | 0.94 | 0.18 | 15.27 | 12.86 | 2.41 | 3.47 | 11.56 |
| 2023-24 | NJD | 82 | 1095:27 | 0.88 | 0.55 | 1.42 | 0.73 | 0.15 | 14.81 | 12.26 | 2.55 | 3.38 | 12.84 |
| 2024-25 | NJD | 82 | 1104:31 | 0.54 | 0.71 | 1.25 | 0.65 | -0.10 | 10.10 | 12.02 | -1.92 | 2.67 | 7.33 |
| 2025-26 | NJD | 82 | 1154:05 | 0.42 | 0.88 | 1.30 | 0.70 | -0.29 | 7.62 | 12.91 | -5.29 | 0.60 | 7.78 |
5v5 On Ice Stats
| Season | Team(s) | GP | TOI | SAF/60 | GF/60 | xGF/60 | SAA/60 | GA/60 | xGA/60 | GF% | xGF% | xGF Rel | xGA Rel | xGF% Rel |
|---|---|---|---|---|---|---|---|---|---|---|---|---|---|---|
| 2021-22 | NJD | 82 | 1099:36 | 43.87 | 3.22 | 2.94 | 45.51 | 4.04 | 2.87 | 44.36 | 50.62 | 0.19 | 0.31 | -1.15 |
| 2022-23 | NJD | 82 | 1070:28 | 43.44 | 3.08 | 3.00 | 40.19 | 2.35 | 2.47 | 56.70 | 54.86 | -0.19 | 0.02 | -1.69 |
| 2023-24 | NJD | 82 | 1095:27 | 40.53 | 2.08 | 2.47 | 42.50 | 3.01 | 2.60 | 40.86 | 48.67 | -0.11 | 0.15 | -2.55 |
| 2024-25 | NJD | 82 | 1104:31 | 39.49 | 2.06 | 2.33 | 41.77 | 1.90 | 2.38 | 52.05 | 49.45 | -0.04 | 0.12 | -1.74 |
| 2025-26 | NJD | 82 | 1154:05 | 44.19 | 1.92 | 2.71 | 39.56 | 2.39 | 2.52 | 44.58 | 51.77 | 0.26 | -0.08 | 3.29 |
NHL Edge Stats
| Skating | Shooting | Zone Time | |||||||||||
|---|---|---|---|---|---|---|---|---|---|---|---|---|---|
| Season | GP | Top Speed | Bursts>20/mi | Avg. Speed | Top Speed | Avg. Speed | %Long Range | %Mid Range | %High Danger | ES DZ% | ES NZ% | ES OZ% | |
| This table is for Basic and Premium subscribers only. To view please login to and/or subscribe to one of our subscription plans. | |||||||||||||
Legend
| Percentile 0-25 | Percentile 25-50 | Percentile 50-75 | Percentile 75-100 |
5v5 Lines
| Season | Teammate | Teammate | Team | TOI | GF/60 | GA/60 | GF% | xGF/60 | xGA/60 | xGF% | xGF Rel | xGA Rel | xGF% Rel |
|---|
Glossary
| Type | Statistic | Definition |
|---|---|---|
| Individual | G/60 | Goals Against per 60 minutes. |
| Individual | A/60 | Assists per 60 minutes. |
| Individual | Pts/60 | Points per 60 minutes. |
| Individual | xG/60 | Expected Goals per 60 minutes. |
| Individual | GAE/60 | Goals Above Expected (G/60 - xG/60). |
| Individual | Sh% | Shooting Percentage. |
| Individual | xSh% | Expected Shooting Percentage. |
| Individual | Sh%AE | Shooting percentage above expected (Sh% - xSh%). |
| Individual | %SA Rush | Percentage of shot attempts determined to be on the rush. |
| Individual | %SA Reb. | Percentage of shot attempts determined to be from rebounds. |
| On Ice | SAF/60 | Shot Attempts For per 60 minutes. |
| On Ice | GF/60 | Goals For per 60 minutes. |
| On Ice | xGF/60 | Expected Goals For per 60 minutes. |
| On Ice | SAA/60 | Shot Attempts Against per 60 minutes (lower is better). |
| On Ice | GA/60 | Goals Against per 60 minutes (lower is better). |
| On Ice | xGA/60 | Expected Goals Against per 60 minutes (lower is better). |
| On Ice | GF% | Goals For Percentage = Goals For / (Goals For + Goals Against) |
| On Ice | xGF% | Expected Goals For Percentage = Expected Goals For / (Expected Goals For + Expected Goals Against) |
| On Ice | xGF Rel | xGF/60 when On Ice - xGF/60 when not On Ice. |
| On Ice | xGA Rel | xGA/60 when On Ice - xGA/60 when not On Ice (lower is better). |
| On Ice | xGF% Rel | xGF% when On Ice - xGF% when not On Ice. |
News and Opinions
-
Dawson Mercer's role with the New Jersey Devils becomes clear at Pucks and Pitchforks (Fri Jul 31, 2026)
-
In Defense of Dawson Mercer at All About the Jersey (Sat Jul 25, 2026)
-
Devils Need to Give Dawson Mercer a Permanent Role on the Third Line at The Hockey Writers (Sat Jul 25, 2026)
-
Are There Any Contract Extension Candidates on the Devils? at All About the Jersey (Wed Jul 22, 2026)
-
Are There Any Contract Extension Candidates on the Devils? at Yahoo Sports NHL (Wed Jul 22, 2026)
-
An Exercise in Analytics: What Would the Ideal Devils Forward Lineup Be? at All About the Jersey (Sat Jul 4, 2026)
-
Pucks and Pitchforks 2026 New Jersey Devils free agency preview at Pucks and Pitchforks (Wed Jul 1, 2026)
-
Should the Devils Pursue Another Top Center? at All About the Jersey (Sat Jun 6, 2026)
-
Ten Predictions For Sunny Mehta’s First Offseason as Devils General Manager at All About the Jersey (Wed Jun 3, 2026)
-
Is it inevitable that Dawson Mercer gets traded by the New Jersey Devils this offseason? at Pucks and Pitchforks (Wed May 27, 2026)
-
What can Dawson Mercer gain from IIHF World Championship appearance? at Pucks and Pitchforks (Tue May 12, 2026)
-
DAB Report Card: Dawson Mercer, F at Devils Army (Thu May 7, 2026)
-
The All About the Jersey Awards for the 2025-26 New Jersey Devils at All About the Jersey (Sun Apr 19, 2026)
-
5 New Jersey Devils players who have played their last game with the franchise at Pucks and Pitchforks (Tue Apr 14, 2026)
-
Hischier Plays Hero; Devils Notch 4-3 Home Finale Win at Devils Army (Mon Apr 13, 2026)
-
Red Wings eliminated from NHL playoff picture with 5-3 loss to Devils at Yahoo Sports NHL (Sat Apr 11, 2026)
-
How much longer would Dawson Mercer have to play to break other Iron Man streaks? at Pucks and Pitchforks (Tue Mar 31, 2026)
-
Some Things I’d Like To See Down The Stretch at All About the Jersey (Mon Mar 30, 2026)
-
Devils’ Dawson Mercer Playing in 400th Game; Approaching Team Iron Man Streak at The Hockey Writers (Sat Mar 28, 2026)
-
Cody Glass and Arseny Gritsyuk Deserve Massive Role Increases at All About the Jersey (Sat Mar 21, 2026)
-
Should Tom Fitzgerald and Mark Dennehy Be Trusted With Another Draft? at All About the Jersey (Sun Mar 15, 2026)
-
What I Want To See From Each New Jersey Devil The Rest Of The Season at All About the Jersey (Mon Mar 9, 2026)
-
Jack Hughes and Nico Hischier’s Excellent Games Propel Devils Past Rangers, 6-3 at All About the Jersey (Sat Mar 7, 2026)
-
Dougie Hamilton, Dawson Mercer, and the Pucks and Pitchforks NHL Trade Deadline preview at Pucks and Pitchforks (Mon Mar 2, 2026)
-
5 New Jersey Devils who might be playing their last games for the franchise at Pucks and Pitchforks (Fri Feb 27, 2026)
-
Re-Signing Priorities for the New Jersey Devils Front Office This Year at All About the Jersey (Sun Feb 8, 2026)
-
NHL Rumors: New Jersey Devils – Dougie Hamilton and Dawson Mercer at NHL Rumors (Tue Jan 13, 2026)
-
3 Takeaways From the Devils’ 3-1 Loss to the Hurricanes at The Hockey Writers (Mon Jan 5, 2026)
-
Dawson Mercer could be odd man out soon for New Jersey Devils at Pucks and Pitchforks (Sun Dec 14, 2025)
-
Dawson Mercer has stepped up when New Jersey Devils needed him the most at Pucks and Pitchforks (Mon Dec 1, 2025)
-
Dawson Mercer’s Back, Here’s Why the Devils Forward is Rebounding at New Jersey Hockey Now (Mon Nov 10, 2025)
-
NJHN Daily: Devils Bad Luck; Mercer Catches Stray; Panarin Goes Full Britney! at New Jersey Hockey Now (Fri Nov 7, 2025)
-
Inside Dawson Mercer’s Hot Start for the Devils at The Hockey Writers (Thu Nov 6, 2025)
-
Devils Coach Dishes Hard Truth on Dawson Mercer’s Early Success at New Jersey Hockey Now (Thu Nov 6, 2025)
-
Dawson Mercer continues hot start to 2025-26 season during NJ Devils’ road trip at Pucks and Pitchforks (Mon Nov 3, 2025)
-
Enter The Dawg Pound: A Look At Dawson Mercer’s Start To The 2025-26 Season at All About the Jersey (Mon Nov 3, 2025)
-
Devils Faceplant Into 4-1 Loss to Ducks at All About the Jersey (Mon Nov 3, 2025)
-
Jacob Markstrom Dethrones the Kings, Delivering 4-1 Devils Win at All About the Jersey (Sun Nov 2, 2025)
-
Markstrom Flips Script, Mercer Stays Hot, Devils Snap Skid vs. Kings at New Jersey Hockey Now (Sun Nov 2, 2025)
-
Devils Look to Sweep Season Series vs. Sharks in San Jose at The Hockey Writers (Thu Oct 30, 2025)
-
Game Preview #9: New Jersey Devils vs. Colorado Avalanche at All About the Jersey (Sun Oct 26, 2025)
-
Dawson Mercer's bounce back makes Cody Glass absence less painful for NJ Devils at Pucks and Pitchforks (Sun Oct 26, 2025)
-
Injury update on Cody Glass is worse than we expected, providing a unique opportunity for Dawson Mercer at Pucks and Pitchforks (Fri Oct 24, 2025)
-
Dawson Mercer Enjoying A Strong Start to the Year at Devils Army (Tue Oct 21, 2025)
-
Nico Hischier, Timo Meier, and Dawson Mercer Vs. Elite Competition: A Look At The Numbers at All About the Jersey (Mon Oct 20, 2025)
-
Jack Hughes Scores Twice In New Jersey Devils’ 5-3 Win Over Edmonton Oilers at All About the Jersey (Sat Oct 18, 2025)
-
Game Preview #5: New Jersey Devils vs. Edmonton Oilers at All About the Jersey (Sat Oct 18, 2025)
-
Devils Takeaways: Mercer Earning Stripes; Gritsyuk Showing Out; Dark Cloud Looms at New Jersey Hockey Now (Mon Oct 13, 2025)
-
The essential New Jersey Devils 2025-26 Season Preview at Pucks and Pitchforks (Thu Oct 9, 2025)
-
The 2025 All About the Jersey Top Five Under 25: The Top Five at All About the Jersey (Tue Oct 7, 2025)
-
New Jersey Devils 2025-26 Season Preview Part 2: Forwards at All About the Jersey (Wed Oct 1, 2025)
-
Devils Coach Answers: Will Dawson Mercer Play Center in 2025-26? at New Jersey Hockey Now (Sun Sep 28, 2025)
-
4 Devils Players Poised for Breakout Season at The Hockey Writers (Wed Sep 17, 2025)
-
Devils 2025-26 Player Previews: Dawson Mercer at The Hockey Writers (Mon Sep 1, 2025)
-
New Jersey Devils, Tom Fitzgerald trying to avoid another Dawson Mercer situation at Pucks and Pitchforks (Sat Aug 30, 2025)
-
Dawson Mercer has a chance to beat Ken Daneyko for a surprising distinction at Pucks and Pitchforks (Fri Aug 29, 2025)
-
Devils’ Potential Milestones to Keep an Eye Out for in 2025-26 at The Hockey Writers (Sun Aug 24, 2025)
-
Should There Be Any Concern That a Luke Hughes Deal Isn’t Done Yet? at All About the Jersey (Wed Aug 13, 2025)
-
New Jersey Devils’ 2024-25 Report Cards: Dawson Mercer at The Hockey Writers (Mon Aug 11, 2025)
-
What role will Dawson Mercer play for the Devils this season? at Pucks and Pitchforks (Fri Aug 8, 2025)
-
Dawson Mercer has a similar trajectory to this supposed New York Yankees' star at Pucks and Pitchforks (Wed Jul 30, 2025)
-
If New Jersey Devils are done making moves, who are Jack Hughes's linemates? at Pucks and Pitchforks (Sun Jul 27, 2025)
-
New Jersey Devils should focus on making Dawson Mercer a great No. 3 center at Pucks and Pitchforks (Fri Jul 25, 2025)
-
How the New Jersey Devils Past Decade of Draft Picks Re-Shaped the Team at The Hockey Writers (Fri Jul 25, 2025)
-
New Jersey Devils can address center issue by trading Dawson Mercer at Pucks and Pitchforks (Mon Jun 30, 2025)
-
New Jersey Devils will likely lose any Dawson Mercer trade at Pucks and Pitchforks (Fri Jun 27, 2025)
-
Nashville Predators shouldn't be finished doing business with New Jersey Devils this offseason at Pred Lines (Fri Jun 27, 2025)
-
2024-25 Final Player Grades: Forwards; Part II at Devils Army (Tue May 13, 2025)
-
Devils End Losing Skid With Dominant Victory Over Boston at Devils Army (Thu Jan 23, 2025)
-
Skidding Devils Look To Salvage Road Trip In Seattle at Devils Army (Mon Jan 6, 2025)
-
Devils Snap Skid, Defeat Kings 3-1 In Sensational Defensive Effort at Devils Army (Fri Dec 13, 2024)
-
Specific Predictions for the New Jersey Devils in 2024-25 at Devils Army (Thu Oct 10, 2024)
-
The Taylor Hall Butterfly Effect is Alive and Well Five Years Later at Devils Army (Mon Jul 8, 2024)
-
Devils Host Penguins As The Regular Season Winds Down at Devils Army (Tue Apr 2, 2024)
-
Devils Win Convincingly, 5-2, Over Penguins at Devils Army (Wed Mar 20, 2024)
-
Devils Fall In Overtime 4-3 After Comeback Against Tampa Bay at Devils Army (Fri Jan 12, 2024)
-
Devils Turn In Strong Outing For 6-3 Win Over Capitals at Devils Army (Thu Jan 4, 2024)
-
New Jersey Kicks off 2024 On The Road In Washington D.C. at Devils Army (Wed Jan 3, 2024)
-
New Jersey Defeats Columbus, 4-3, In Comeback Fashion at Devils Army (Thu Dec 28, 2023)
-
Sluggish, Sloppy Devils Blanked by Red Wings at Devils Army (Thu Nov 23, 2023)
-
New Jersey Registers 4-2 Victory Over Chicago at Devils Army (Mon Nov 6, 2023)
-
Dawson Mercer Continues Excellence Into Contract Year at Devils Army (Tue Oct 10, 2023)
-
Analyzing Every Single Devils’ Need Position By Position at Devils Army (Wed Jun 14, 2023)
-
Devils Thrash Rangers in Pivotal Game Five, Take 3-2 Series Lead at Devils Army (Fri Apr 28, 2023)
-
Devils Look To Keep Rolling Against Woeful Blue Jackets at Devils Army (Thu Apr 6, 2023)
-
Devils Dominate Penguins 5-1, Sweep Season Series at Devils Army (Wed Apr 5, 2023)
-
Picking Out A Nickname For Dawson Mercer at Devils Army (Tue Mar 7, 2023)
-
Adin Hill Stumps Devils In 4-3 Shootout Loss at Devils Army (Sat Mar 4, 2023)
-
Devils Welcome Struggling Flyers To The Prudential Center at Devils Army (Sat Feb 25, 2023)
-
Devils With Another Fantastic Overtime Comeback Over Los Angeles at Devils Army (Fri Feb 24, 2023)
-
Devils Can’t Solve Montembault, Suffer Frustrating 5-2 Loss at Devils Army (Wed Feb 22, 2023)
-
Devils Look For Third-Straight Win, Host Struggling Canadiens at Devils Army (Tue Feb 21, 2023)
-
Mercer, Devils Come Back to Beat Winnipeg 4-2 at Devils Army (Mon Feb 20, 2023)
-
Surging Devils Head to California to Battle Struggling Ducks at Devils Army (Fri Jan 13, 2023)
-
Devils Comeback Again, Defeat Hurricanes In 5-3 Thriller at Devils Army (Wed Jan 11, 2023)
-
Three Years Later, The Impact Of The Taylor Hall Trade at Devils Army (Thu Dec 8, 2022)
-
Previewing the 2022-23 New Jersey Devils’ Forward Group: Part II at Devils Army (Wed Oct 12, 2022)
-
Ranking All 2022 New Jersey Devils Rookies, Part II at Devils Army (Tue May 17, 2022)
-
2021-2022 New Jersey Devils Team Awards at Devils Army (Mon May 2, 2022)
-
What Jack Hughes Season Ending Injury Means For The New Jersey Devils’ Offense at Devils Army (Fri Apr 8, 2022)
-
Analyzing The New Jersey Devils’ 2021-22 Opening Night Roster at Devils Army (Tue Oct 12, 2021)
-
New Jersey Devils Emerge Victorious in Final Game of the Prospect Challenge at Devils Army (Sun Sep 19, 2021)
-
2021 World Junior Championships – Part I: Overview and Team Profiles at Devils Army (Wed Dec 23, 2020)
-
New Jersey Devils’ Day One Draft Grades and Player Breakdowns at Devils Army (Wed Oct 7, 2020)
-
Devils Army Blog 2020 NHL Mock Draft at Devils Army (Tue Oct 6, 2020)
-
New Jersey Devils’ 2020 NHL Draft Preview at Devils Army (Tue Oct 6, 2020)
-
Devils Draft Series: Dawson Mercer, Underrated QMJHL Scorer at Devils Army (Sat May 16, 2020)
Current Contract
Dawson Mercer signed a $12,000,000 3-year contract with the New Jersey Devils and General Manager Tom Fitzgerald on September 20, 2024 with an AAV of $4,000,000. This contract will start in 2024-25 and end after the 2026-27 season. In the first season of the contract the cap hit was equivalent to 4.55% of the salary cap.
Standard Contract (RFA) ( ) (0 ratings)
Dawson Mercer signed a $2,775,000 3-year contract with the New Jersey Devils and General Manager Tom Fitzgerald on December 24, 2020 with an AAV of $925,000. This contract will start in 2020-21 and end after the 2023-24 season. In the first season of the contract the cap hit was equivalent to 1.13% of the salary cap.
Entry Level Contract ( ) (0 ratings)
| Season | Age* | Clause | Cap Hit | AAV | Perf. Bonus | Sign. Bonus | Salary | Compensation | Minors Salary | Status | |
|---|---|---|---|---|---|---|---|---|---|---|---|
| 2020-21 | 18 | $925,000 | $1,325,000 | - | $92,500 | - | $92,500 | - | ELC | ||
| 2021-22 | 19 | $894,167 | $1,294,167 | $400,000 | $92,500 | $832,500 | $925,000 | $80,000 | ELC | ||
| 2022-23 | 20 | $894,167 | $1,294,167 | $400,000 | $92,500 | $832,500 | $925,000 | $80,000 | ELC | ||
| 2023-24 | 21 | $894,167 | $1,294,167 | $400,000 | - | $832,500 | $832,500 | $80,000 | ELC | ||
| Total | $1,200,000 | $277,500 | $2,497,500 | $2,775,000 | $240,000 |
Career Statistics
| Regular Season | Playoffs | |||||||||||||||||||
|---|---|---|---|---|---|---|---|---|---|---|---|---|---|---|---|---|---|---|---|---|
| Season | League | Team | GP | G | A | Pts | +/- | PIM | Shots | Sh% | TOI/G | GP | G | A | Pts | +/- | PIM | Shots | Sh% | TOI/G |
| 2014-15 | ACC-U14 | Team Newfoundland U14 (ACC) | 5 | 2 | 2 | 4 | 2 | |||||||||||||
| 2014-15 | NLBAAAHL | Tri Pen Ice | 28 | 20 | 23 | 43 | 30 | 5 | 5 | 8 | 13 | |||||||||
| 2015-16 | ACC-U15 | Team Newfoundland U15 (ACC) | 5 | 2 | 3 | 5 | ||||||||||||||
| 2015-16 | NLAAAHL U15 | Tri Pen Ice U15 AAA | 24 | 42 | 26 | 68 | 41 | 4 | 8 | 2 | 10 | 2 | ||||||||
| 2016-17 | PSHF U18 | Bishop's College School Varsity | 11 | 6 | 6 | 12 | ||||||||||||||
| 2016-17 | QGC-16 | Team Newfoundland | 5 | 4 | 9 | 13 | ||||||||||||||
| 2016-17 | PSHF U16 | Bishop's College School Prep U16 | 4 | 0 | 0 | 0 | ||||||||||||||
| 2016-17 | MPHL | Bishop's College School Varsity | 18 | 8 | 14 | 22 | 8 | 3 | 2 | |||||||||||
| 2017-18 | WHC-17 | Canada Black U17 | 5 | 2 | 0 | 2 | ||||||||||||||
| 2017-18 | U17-Dev | Team Blue | 3 | 1 | 0 | 1 | ||||||||||||||
| 2017-18 | QMJHL | Drummondville Voltigeurs | 61 | 11 | 15 | 26 | +8 | 25 | 10 | 1 | 3 | 4 | ||||||||
| 2018-19 | QMJHL | Drummondville Voltigeurs | 68 | 30 | 34 | 64 | +31 | 50 | 16 | 5 | 11 | 16 | +7 | 8 | ||||||
| 2019-20 | QMJHL | Drummondville Voltigeurs | 26 | 18 | 24 | 42 | +3 | 21 | ||||||||||||
| 2019-20 | QMJHL | Chicoutimi Saguenéens | 16 | 6 | 12 | 18 | +2 | 4 | ||||||||||||
| 2019-20 | WJC-20 | Canada U20 | 7 | 0 | 0 | 0 | -1 | |||||||||||||
| 2020-21 | WJC-20 | Canada U20 | 7 | 2 | 4 | 6 | +7 | 2 | ||||||||||||
| 2020-21 | QMJHL | Chicoutimi Saguenéens | 23 | 19 | 17 | 36 | +15 | 6 | 9 | 6 | 11 | 17 | +5 | 4 | ||||||
| 2021-22 | NHL | New Jersey Devils | 82 | 17 | 25 | 42 | -25 | 28 | 154 | 11.0 | 16:32 | |||||||||
| 2021-22 | WC | Canada | 10 | 0 | 5 | 5 | +5 | |||||||||||||
| 2022-23 | NHL | New Jersey Devils | 82 | 27 | 29 | 56 | +22 | 14 | 161 | 16.8 | 16:34 | 12 | 3 | 4 | 7 | -1 | 2 | 16 | 18.8 | 16:38 |
| 2023-24 | NHL | New Jersey Devils | 82 | 20 | 13 | 33 | -26 | 29 | 134 | 14.9 | 17:13 | |||||||||
| 2024-25 | NHL | New Jersey Devils | 82 | 19 | 17 | 36 | +4 | 16 | 141 | 13.5 | 17:53 | 5 | 2 | 2 | -6 | 8 | 8 | 25.0 | 21:05 | |
| 2025-26 | NHL | New Jersey Devils | 82 | 20 | 22 | 42 | -2 | 33 | 158 | 12.7 | 18:14 | |||||||||
| NHL Career | 410 | 103 | 106 | 209 | -27 | 120 | 748 | 13.8 | 17:17 | 17 | 5 | 4 | 9 | -7 | 10 | 24 | 20.8 | 17:56 | ||