
Zach Parise
| Position | Left Wing | Current Team | |
| Shoots | Left | Current Contract | |
| Height | 5'11" | Expires | |
| Weight (lbs) | 195 | Expiry Age (Jun 30) | |
| Age (DOB) | 41 (July 28, 1984) | Expiry Status | |
| Drafted | 2003, Round 1, Overall 17 (NJD) |
| Date | Team | Transaction | |
|---|---|---|---|
| Jan 26, 2024 | Colorado Avalanche | Signed 1 year @ $825K AAV starting in 2023-24 | |
| Mar 21, 2022 | New York Islanders | Signed 1 year @ $1.500M AAV starting in 2022-23 | |
| Oct 10, 2021 | New York Islanders | Signed 1 year @ $1.500M AAV starting in 2021-22 | |
| Jul 13, 2021 | Minnesota Wild | Contract bought out | |
| Jul 4, 2012 | Minnesota Wild | Signed 13 years @ $7.538M AAV starting in 2012-13 | |
| Jul 29, 2011 | New Jersey Devils | Signed 1 year @ $6.000M AAV starting in 2011-12 | |
| Aug 1, 2007 | New Jersey Devils | Signed 4 years @ $3.125M AAV starting in 2007-8 |
Player Card(s)
URL: https://thestanleycap.com/cdn/player_cards/20232024/zach-parise-8470610.png
About Player Cards
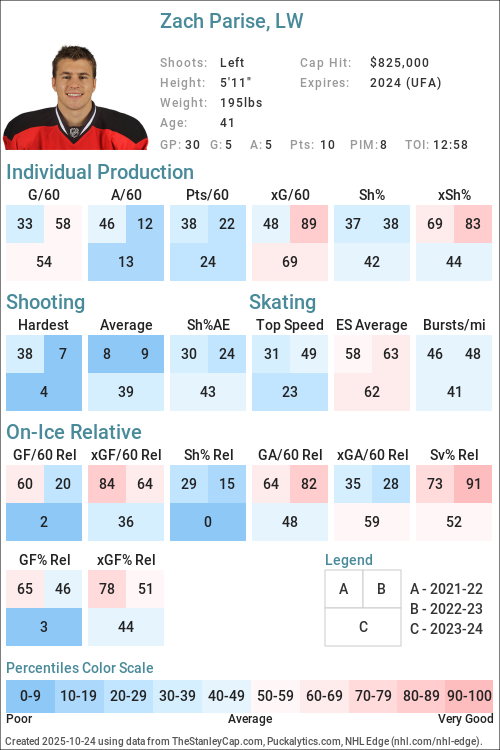
Player cards present an infographic of a players performance using a series of Player Archetypes developed for Puckalytics.com and TheStanleyCap.com. The boxes in the rink image show the archetype ratings for the season specified in the card while the graphs to the right show the five-year trends for those archetypes.
Except for Faceoffs, the values shown are the players z-score (standard deviation from the mean) for the specific metric used to calculate the archetype values. When calculating z-scores forwards were compared to forwards and defensemen were compared to defensemen. Positive values indicate the player is above average and shaded in blue, while negative values indicate the player is below average and shaded in pink. The five year trend charts show a range of -4.0 to 4.0.
The value shown for Faceoffs is the faceoff winning percentage rather than their z-score with winning percentages below 50 in pink shades and above 50 in blue shades.
All archetypes are 5v5 except 5v4 TOI, 4v5 TOI, Skating (even strength) and Faceoffs (all situations). Archetypes use regular season data only.
Archetypes Summary
- Sniper - Measures the to score above the expected goal rate.
- Rebound - Measures the percent of a players shot attempts that come from rebounds (forwards only).
- 5v4 TOI - Powerplay ice time, calculated as the percentage of his teams 5v4 ice time that the player was on the ice for.
- Shooter - Measures whether a players points come from shots (goals or assists on rebounds from his shots).
- Producer - Measures a players ability to produce goals and assists, adjusted for quality of teammates.
- Playmaker - Measures whether a players points come from passes.
- Drive - Measures a players ability to drive puck possession and generate shot attempts for his team.
- Rush - Measures the percent of a players shot attempts that come from rush plays
- Possession - An indicator of a players ability to improve his teams puck possession game.
- Faceoffs - Faceoff Winning Percentage (min. 75 faceoffs taken).
- 5v5 TOI - The percentage of his teams 5v5 TOI that the player was on the ice for.
- Suppress - Measures a players ability to suppress opponent puck possession and shot attempts against.
- Skating - An indicator of a players skating ability, or speed bursts above 20mph per mile skated.
- Defend - An indicator of a players ability to suppress shot quality against.
- 4v5 TOI - Penalty Kill ice time, calculated as the percentage of his teams 4v5 ice time that the player was on the ice for.
Data Sources
- Salary data is from TheStanleyCap.com
- Skating data is from NHL Edge
- Other statistics are from Puckalytics.com and derived from data from NHL.com
Terms of Use
You are free to use include player cards in written articles, share on social media, or on other public websites under the following conditions:
- You credit TheStanleyCap.com as the source and provide a link back to TheStanleyCap.com or this player page.
- You do not mass copy/duplicate/publish dozens or hundreds of player cards. A few, or a handful for a written article is fine. Be reasonable. Fair use rules apply.
- If you are a high-traffic website you must download and host the image(s) on your site rather than overload TheStanleyCap servers with traffic.
Note: Player cards will update daily throughout the season so if you want to include snapshot then you must download the image.
If you have any questions, send an e-mail to the e-mail address at the top of this page.
Read Introducing Player Archetypes on HockeyAnalysis.com for more details on archetype calculations.
Core Archetypes
| Season | Team(s) | GP | TOI | Producer | Playmaker | Shooter | Sniper | Rebound | Rush | Skating | Defend |
|---|---|---|---|---|---|---|---|---|---|---|---|
| 2015-16 | MIN | 70 | 0.48 | -0.76 | 1.75 | 0.28 | 1.90 | -0.15 | - | 0.93 | |
| 2016-17 | MIN | 69 | 0.54 | 0.07 | 0.37 | -0.42 | 1.85 | 0.56 | - | -1.14 | |
| 2017-18 | MIN | 42 | 0.07 | -0.80 | 1.08 | 0.66 | -0.81 | 0.65 | - | -0.71 | |
| 2018-19 | MIN | 74 | 0.74 | 0.42 | 0.38 | 0.20 | 2.53 | -0.46 | - | -1.53 | |
| 2019-20 | MIN | 69 | -0.33 | -0.22 | -0.38 | -0.78 | 1.68 | -1.09 | - | -0.25 | |
| 2020-21 | MIN | 45 | -0.53 | -0.55 | -0.25 | 0.11 | -0.46 | 0.38 | - | -0.32 | |
| 2021-22 | NYI | 81 | -0.48 | -0.01 | -0.74 | -0.62 | -0.05 | 0.26 | -0.28 | 0.62 | |
| 2022-23 | NYI | 82 | -0.79 | -1.06 | 0.03 | -0.67 | 3.14 | -0.11 | -0.28 | 1.34 | |
| 2023-24 | COL | 30 | -0.48 | -0.85 | 0.16 | -0.06 | -0.20 | 4.33 | -0.40 | 0.10 |
Situational and Secondary Archetypes
| Season | Team(s) | GP | TOI | 5v5 TOI | 5v4 TOI | 4v5 TOI | Possession | Drive | Suppress | Faceoffs |
|---|---|---|---|---|---|---|---|---|---|---|
| 2015-16 | MIN | 70 | 1.15 | 1.32 | -1.47 | 0.23 | 1.47 | -2.09 | - | |
| 2016-17 | MIN | 69 | 0.44 | 0.55 | 0.04 | 0.08 | 1.32 | -1.96 | - | |
| 2017-18 | MIN | 42 | 0.35 | 0.72 | -0.77 | -0.79 | -0.09 | -1.34 | - | |
| 2018-19 | MIN | 74 | 0.70 | 0.85 | -0.25 | 0.42 | 0.54 | -0.07 | - | |
| 2019-20 | MIN | 69 | 0.29 | 0.57 | -0.66 | -0.28 | 0.67 | -1.62 | 53.2 | |
| 2020-21 | MIN | 45 | -0.40 | -0.57 | -1.47 | -0.40 | -0.05 | -0.76 | 41.5 | |
| 2021-22 | NYI | 81 | -0.57 | -0.10 | 0.58 | 0.89 | 1.43 | -0.83 | - | |
| 2022-23 | NYI | 82 | -0.07 | -0.45 | 1.00 | -1.01 | -0.41 | -1.21 | - | |
| 2023-24 | COL | 30 | -0.59 | -1.54 | -0.47 | -0.71 | -0.81 | -0.19 | - |
5v5 Individual Stats
| Season | Team(s) | GP | TOI | G/60 | A/60 | Pts/60 | xG/60 | GAE/60 | Sh% | xSh% | Sh%AE | %SA Rush | %SA Reb. |
|---|---|---|---|---|---|---|---|---|---|---|---|---|---|
| 2015-16 | MIN | 70 | 950:34 | 0.95 | 0.57 | 1.51 | 0.90 | 0.05 | 10.87 | 10.30 | 0.57 | 3.74 | 9.63 |
| 2016-17 | MIN | 69 | 872:38 | 0.83 | 1.10 | 1.93 | 0.98 | -0.15 | 8.70 | 10.30 | -1.60 | 5.17 | 9.20 |
| 2017-18 | MIN | 42 | 528:06 | 0.91 | 0.80 | 1.70 | 0.71 | 0.20 | 10.39 | 8.15 | 2.24 | 5.26 | 3.16 |
| 2018-19 | MIN | 74 | 976:43 | 0.92 | 1.11 | 2.03 | 0.87 | 0.05 | 10.27 | 9.76 | 0.52 | 3.17 | 11.11 |
| 2019-20 | MIN | 69 | 843:55 | 0.64 | 0.92 | 1.56 | 0.86 | -0.22 | 8.65 | 11.58 | -2.93 | 1.50 | 11.28 |
| 2020-21 | MIN | 45 | 510:18 | 0.82 | 0.82 | 1.65 | 0.78 | 0.05 | 10.14 | 9.57 | 0.57 | 4.55 | 4.55 |
| 2021-22 | NYI | 81 | 938:14 | 0.58 | 0.90 | 1.47 | 0.73 | -0.15 | 8.91 | 11.23 | -2.32 | 4.55 | 6.06 |
| 2022-23 | NYI | 82 | 995:01 | 0.72 | 0.54 | 1.27 | 0.97 | -0.24 | 8.96 | 11.95 | -3.00 | 3.55 | 17.16 |
| 2023-24 | COL | 30 | 339:40 | 0.71 | 0.53 | 1.24 | 0.72 | -0.01 | 9.30 | 9.45 | -0.15 | 12.96 | 7.41 |
5v5 On Ice Stats
| Season | Team(s) | GP | TOI | SAF/60 | GF/60 | xGF/60 | SAA/60 | GA/60 | xGA/60 | GF% | xGF% | xGF Rel | xGA Rel | xGF% Rel |
|---|---|---|---|---|---|---|---|---|---|---|---|---|---|---|
| 2015-16 | MIN | 70 | 950:34 | 43.24 | 1.96 | 2.28 | 43.81 | 1.83 | 2.26 | 51.67 | 50.29 | 0.30 | 0.40 | -1.40 |
| 2016-17 | MIN | 69 | 872:38 | 45.65 | 3.03 | 2.76 | 45.31 | 2.89 | 2.22 | 51.16 | 55.45 | 0.54 | 0.37 | 0.87 |
| 2017-18 | MIN | 42 | 528:06 | 39.65 | 2.61 | 2.28 | 44.76 | 2.61 | 2.05 | 50.00 | 52.61 | 0.03 | 0.11 | -1.04 |
| 2018-19 | MIN | 74 | 976:43 | 45.03 | 2.83 | 2.53 | 39.81 | 2.76 | 2.17 | 50.55 | 53.88 | 0.12 | 0.20 | -1.13 |
| 2019-20 | MIN | 69 | 843:55 | 43.72 | 2.63 | 2.64 | 45.57 | 2.99 | 2.23 | 46.84 | 54.20 | 0.41 | 0.22 | 1.66 |
| 2020-21 | MIN | 45 | 510:18 | 37.51 | 3.29 | 2.38 | 43.15 | 2.59 | 2.24 | 56.00 | 51.53 | 0.24 | 0.22 | -0.01 |
| 2021-22 | NYI | 81 | 938:14 | 43.42 | 2.43 | 2.85 | 45.85 | 2.24 | 2.87 | 52.05 | 49.85 | 0.50 | 0.09 | 3.98 |
| 2022-23 | NYI | 82 | 995:01 | 40.46 | 2.11 | 2.71 | 46.01 | 1.81 | 2.79 | 53.85 | 49.28 | 0.08 | 0.13 | -0.52 |
| 2023-24 | COL | 30 | 339:40 | 43.28 | 1.77 | 2.53 | 42.75 | 2.47 | 2.38 | 41.67 | 51.51 | -0.26 | -0.08 | -1.64 |
NHL Edge Stats
| Skating | Shooting | Zone Time | |||||||||||
|---|---|---|---|---|---|---|---|---|---|---|---|---|---|
| Season | GP | Top Speed | Bursts>20/mi | Avg. Speed | Top Speed | Avg. Speed | %Long Range | %Mid Range | %High Danger | ES DZ% | ES NZ% | ES OZ% | |
| This table is for Basic and Premium subscribers only. To view please login to and/or subscribe to one of our subscription plans. | |||||||||||||
Legend
| Percentile 0-25 | Percentile 25-50 | Percentile 50-75 | Percentile 75-100 |
5v5 Lines
| Season | Teammate | Teammate | Team | TOI | GF/60 | GA/60 | GF% | xGF/60 | xGA/60 | xGF% | xGF Rel | xGA Rel | xGF% Rel |
|---|
Glossary
| Type | Statistic | Definition |
|---|---|---|
| Individual | G/60 | Goals Against per 60 minutes. |
| Individual | A/60 | Assists per 60 minutes. |
| Individual | Pts/60 | Points per 60 minutes. |
| Individual | xG/60 | Expected Goals per 60 minutes. |
| Individual | GAE/60 | Goals Above Expected (G/60 - xG/60). |
| Individual | Sh% | Shooting Percentage. |
| Individual | xSh% | Expected Shooting Percentage. |
| Individual | Sh%AE | Shooting percentage above expected (Sh% - xSh%). |
| Individual | %SA Rush | Percentage of shot attempts determined to be on the rush. |
| Individual | %SA Reb. | Percentage of shot attempts determined to be from rebounds. |
| On Ice | SAF/60 | Shot Attempts For per 60 minutes. |
| On Ice | GF/60 | Goals For per 60 minutes. |
| On Ice | xGF/60 | Expected Goals For per 60 minutes. |
| On Ice | SAA/60 | Shot Attempts Against per 60 minutes (lower is better). |
| On Ice | GA/60 | Goals Against per 60 minutes (lower is better). |
| On Ice | xGA/60 | Expected Goals Against per 60 minutes (lower is better). |
| On Ice | GF% | Goals For Percentage = Goals For / (Goals For + Goals Against) |
| On Ice | xGF% | Expected Goals For Percentage = Expected Goals For / (Expected Goals For + Expected Goals Against) |
| On Ice | xGF Rel | xGF/60 when On Ice - xGF/60 when not On Ice. |
| On Ice | xGA Rel | xGA/60 when On Ice - xGA/60 when not On Ice (lower is better). |
| On Ice | xGF% Rel | xGF% when On Ice - xGF% when not On Ice. |
News and Opinions
-
Zach Parise and Ryan Suter weren't the disaster they seemed for the Minnesota Wild at Gone Puck Wild (Thu Jul 16, 2026)
-
This former Devils star could beat Patrik Elias to the Hall of Fame at Pucks and Pitchforks (Fri Jun 26, 2026)
-
The Best Devils Team to Never Win The Stanley Cup With Them at All About the Jersey (Wed Jun 10, 2026)
-
The Best Devils Team to Never Win The Stanley Cup With Them at Yahoo Sports NHL (Wed Jun 10, 2026)
-
There's No Reason To Worry About A Parise/Suter Repeat For the Wild at Hockey Wilderness (Mon Feb 9, 2026)
-
The world has forgotten the night Zach Parise returned to face the New Jersey Devils at Pucks and Pitchforks (Sat Jan 24, 2026)
-
Zach Parise Reflects On Illustrious Career During U.S. Hockey Hall Of Fame Induction at The Hockey News (Fri Dec 12, 2025)
-
Zach Parise's U.S. Hockey Hall Of Fame Induction Will Be A Full-Circle Moment at Hockey Wilderness (Sat Sep 6, 2025)
-
Joe Pavelski, Zach Parise, Scott Gomez headline U.S. Hockey Hall of Fame class of 2025 at NBC Sports (Thu Sep 4, 2025)
-
Zach Parise Elected to USA Hockey Hall of Fame at Colorado Hockey Now (Thu Sep 4, 2025)
-
Jack Hughes still trails Zach Parise as the best American player in NJ Devils history at Pucks and Pitchforks (Thu Sep 4, 2025)
-
Scott Gomez & Zach Parise Named to US Hockey Hall of Fame at The Hockey Writers (Wed Sep 3, 2025)
-
Former Wild forward receives new honor at Gone Puck Wild (Wed Sep 3, 2025)
-
Joe Pavelski, Zach Parise, Scott Gomez headline USA Hockey’s 2025 Hall of Fame class at Yahoo Sports NHL (Wed Sep 3, 2025)
-
Parise, Pavelski, Gomez Feature In U.S. Hockey Hall Of Fame's Class Of 2025 at Yahoo Sports NHL (Wed Sep 3, 2025)
-
Reviewing ChatGPT’s Top-Ten New Jersey Devils Of All Time List at Devils Army (Tue Aug 8, 2023)
Current Contract
Player does not currently have a contract.Zach Parise signed a $825,000 1-year contract with the Colorado Avalanche and General Manager Chris MacFarland on January 26, 2024 with an AAV of $825,000. This contract will start in 2023-24 and end after the 2023-24 season. In the first season of the contract the cap hit was equivalent to 0.99% of the salary cap.
35+ Contract ( ) (0 ratings)
| Season | Age* | Clause | Cap Hit | AAV | Perf. Bonus | Sign. Bonus | Salary | Compensation | Minors Salary | Status | |
|---|---|---|---|---|---|---|---|---|---|---|---|
| 2023-24 | 39 | $825,000 | $825,000 | - | - | $825,000 | $825,000 | $825,000 | UFA | ||
| Total | - | - | $825,000 | $825,000 | $825,000 |
Zach Parise signed a $750,000 1-year contract with the New York Islanders and General Manager Lou Lamoriello on March 21, 2022 with an AAV of $750,000. This contract will start in 2022-23 and end after the 2022-23 season. In the first season of the contract the cap hit was equivalent to 0.91% of the salary cap.
35+ Contract ( ) (0 ratings)
| Season | Age* | Clause | Cap Hit | AAV | Perf. Bonus | Sign. Bonus | Salary | Compensation | Minors Salary | Status | |
|---|---|---|---|---|---|---|---|---|---|---|---|
| 2022-23 | 38 | $750,000 | $1,500,000 | $750,000 | - | $750,000 | $750,000 | $750,000 | UFA | ||
| Total | $750,000 | - | $750,000 | $750,000 | $750,000 |
Zach Parise signed a $750,000 1-year contract with the New York Islanders and General Manager Lou Lamoriello on October 10, 2021 with an AAV of $750,000. This contract will start in 2021-22 and end after the 2021-22 season. In the first season of the contract the cap hit was equivalent to 0.92% of the salary cap.
35+ Contract ( ) (0 ratings)
| Season | Age* | Clause | Cap Hit | AAV | Perf. Bonus | Sign. Bonus | Salary | Compensation | Minors Salary | Status | |
|---|---|---|---|---|---|---|---|---|---|---|---|
| 2021-22 | 37 | $750,000 | $1,500,000 | $750,000 | - | $750,000 | $750,000 | $750,000 | UFA | ||
| Total | $750,000 | - | $750,000 | $750,000 | $750,000 |
Zach Parise signed a $98,000,000 13-year contract with the Minnesota Wild and General Manager Chuck Fletcher on July 4, 2012 with an AAV of $7,538,462. This contract will start in 2012-13 and end after the 2024-25 season. In the first season of the contract the cap hit was equivalent to 12.56% of the salary cap. The Minnesota Wild bought out this contract on July 13, 2021.
Standard Contract (UFA) ( ) (0 ratings)
| Season | Age* | Clause | Cap Hit | AAV | Perf. Bonus | Sign. Bonus | Salary | Compensation | Minors Salary | Status | |
|---|---|---|---|---|---|---|---|---|---|---|---|
| 2012-13 | 28 | NMC | $7,538,462 | $7,538,462 | - | $10,000,000 | $2,000,000 | $12,000,000 | $12,000,000 | UFA | |
| 2013-14 | 29 | NMC | $7,538,462 | $7,538,462 | - | $10,000,000 | $2,000,000 | $12,000,000 | $12,000,000 | UFA | |
| 2014-15 | 30 | NMC | $7,538,462 | $7,538,462 | - | $5,000,000 | $6,000,000 | $11,000,000 | $11,000,000 | UFA | |
| 2015-16 | 31 | NMC | $7,538,462 | $7,538,462 | - | - | $9,000,000 | $9,000,000 | $9,000,000 | UFA | |
| 2016-17 | 32 | NMC | $7,538,462 | $7,538,462 | - | - | $9,000,000 | $9,000,000 | $9,000,000 | UFA | |
| 2017-18 | 33 | NMC | $7,538,462 | $7,538,462 | - | - | $9,000,000 | $9,000,000 | $9,000,000 | UFA | |
| 2018-19 | 34 | NMC | $7,538,462 | $7,538,462 | - | - | $9,000,000 | $9,000,000 | $9,000,000 | UFA | |
| 2019-20 | 35 | NMC | $7,538,462 | $7,538,462 | - | - | $9,000,000 | $9,000,000 | $9,000,000 | UFA | |
| 2020-21 | 36 | NMC | $7,538,462 | $7,538,462 | - | - | $8,000,000 | $8,000,000 | $8,000,000 | UFA | |
| 2021-22 | 37 | NMC | $7,538,462 | $7,538,462 | - | - | $6,000,000 | $6,000,000 | $6,000,000 | UFA | |
| 2022-23 | 38 | NMC | $7,538,462 | $7,538,462 | - | - | $2,000,000 | $2,000,000 | $2,000,000 | UFA | |
| 2023-24 | 39 | NMC | $7,538,462 | $7,538,462 | - | - | $1,000,000 | $1,000,000 | $1,000,000 | UFA | |
| 2024-25 | 40 | NMC | $7,538,462 | $7,538,462 | - | - | $1,000,000 | $1,000,000 | $1,000,000 | UFA | |
| Total | - | $25,000,000 | $73,000,000 | $98,000,000 | $98,000,000 |
Zach Parise signed a $6,000,000 1-year contract with the New Jersey Devils and General Manager Lou Lamoriello on July 29, 2011 with an AAV of $6,000,000. This contract will start in 2011-12 and end after the 2011-12 season. In the first season of the contract the cap hit was equivalent to 9.33% of the salary cap.
Standard Contract (RFA) ( ) (0 ratings)
| Season | Age* | Clause | Cap Hit | AAV | Perf. Bonus | Sign. Bonus | Salary | Compensation | Minors Salary | Status | |
|---|---|---|---|---|---|---|---|---|---|---|---|
| 2011-12 | 27 | $6,000,000 | $6,000,000 | - | - | $6,000,000 | $6,000,000 | $6,000,000 | RFA-arb | ||
| Total | - | - | $6,000,000 | $6,000,000 | $6,000,000 |
Zach Parise signed a $12,500,000 4-year contract with the New Jersey Devils and General Manager Lou Lamoriello on August 1, 2007 with an AAV of $3,125,000. This contract will start in 2007-08 and end after the 2010-11 season. In the first season of the contract the cap hit was equivalent to 6.21% of the salary cap.
Standard Contract (RFA) ( ) (0 ratings)
| Season | Age* | Clause | Cap Hit | AAV | Perf. Bonus | Sign. Bonus | Salary | Compensation | Minors Salary | Status | |
|---|---|---|---|---|---|---|---|---|---|---|---|
| 2007-08 | 23 | $3,125,000 | $3,125,000 | - | - | $2,000,000 | $2,000,000 | $2,000,000 | RFA | ||
| 2008-09 | 24 | $3,125,000 | $3,125,000 | - | - | $2,500,000 | $2,500,000 | $2,500,000 | RFA-arb | ||
| 2009-10 | 25 | $3,125,000 | $3,125,000 | - | - | $3,000,000 | $3,000,000 | $3,000,000 | RFA-arb | ||
| 2010-11 | 26 | $3,125,000 | $3,125,000 | - | - | $5,000,000 | $5,000,000 | $5,000,000 | RFA-arb | ||
| Total | - | - | $12,500,000 | $12,500,000 | $12,500,000 |
Contract Buyout Details
Minnesota Wild
| Season | Original Compensation | Buyout Compensation | Compensation Savings | Original Caphit | Buyout Caphit | Caphit Savings |
|---|---|---|---|---|---|---|
| 2022-23 | $6,000,000 | $833,333 | $5,166,667 | $7,538,462 | $2,371,795 | $5,166,667 |
| 2023-24 | $2,000,000 | $833,333 | $1,166,667 | $7,538,462 | $6,371,795 | $1,166,667 |
| 2024-25 | $1,000,000 | $833,333 | $166,667 | $7,538,462 | $7,371,795 | $166,667 |
| 2025-26 | $1,000,000 | $833,333 | $166,667 | $7,538,462 | $7,371,795 | $166,667 |
| 2026-27 | - | $833,333 | $-833,333 | - | $833,333 | $-833,333 |
| 2027-28 | - | $833,333 | $-833,333 | - | $833,333 | $-833,333 |
| 2028-29 | - | $833,333 | $-833,333 | - | $833,333 | $-833,333 |
| 2029-30 | - | $833,333 | $-833,333 | - | $833,333 | $-833,333 |
Career Statistics
| Regular Season | Playoffs | |||||||||||||||||||
|---|---|---|---|---|---|---|---|---|---|---|---|---|---|---|---|---|---|---|---|---|
| Season | League | Team | GP | G | A | Pts | +/- | PIM | Shots | Sh% | TOI/G | GP | G | A | Pts | +/- | PIM | Shots | Sh% | TOI/G |
| 2000-01 | High-MN | Shat.-St. Mary's | 58 | 69 | 93 | 162 | ||||||||||||||
| 2001-02 | High-MN | Shat.-St. Mary's | 67 | 77 | 101 | 178 | 58 | |||||||||||||
| 2001-02 | U-18 | USNTDP | 12 | 7 | 7 | 14 | 6 | |||||||||||||
| 2001-02 | WJ18-A | USA | 8 | 7 | 3 | 10 | 6 | |||||||||||||
| 2002-03 | WCHA | North Dakota | 39 | 26 | 35 | 61 | 34 | |||||||||||||
| 2002-03 | WJC-A | USA | 7 | 4 | 4 | 8 | 4 | |||||||||||||
| 2003-04 | WCHA | North Dakota | 37 | 23 | 32 | 55 | 24 | |||||||||||||
| 2003-04 | WJC-A | USA | 6 | 5 | 6 | 11 | 4 | |||||||||||||
| 2004-05 | AHL | Albany | 73 | 18 | 40 | 58 | -11 | 56 | ||||||||||||
| 2004-05 | WC-A | USA | 3 | 0 | 2 | 2 | ||||||||||||||
| 2005-06 | NHL | New Jersey Devils | 81 | 14 | 18 | 32 | -1 | 28 | 133 | 10.5 | 13:08 | 9 | 1 | 2 | 3 | 2 | 21 | 4.8 | 15:03 | |
| 2006-07 | WC-A | USA | 1 | 0 | 0 | 0 | ||||||||||||||
| 2006-07 | NHL | New Jersey Devils | 82 | 31 | 31 | 62 | -3 | 30 | 247 | 12.6 | 17:32 | 11 | 7 | 3 | 10 | +4 | 8 | 45 | 15.6 | 19:08 |
| 2007-08 | WC-A | USA | 7 | 5 | 3 | 8 | 2 | |||||||||||||
| 2007-08 | NHL | New Jersey Devils | 81 | 32 | 33 | 65 | +13 | 25 | 266 | 12.0 | 18:04 | 5 | 1 | 4 | 5 | -5 | 2 | 20 | 5.0 | 18:29 |
| 2008-09 | NHL | New Jersey Devils | 82 | 45 | 49 | 94 | +30 | 24 | 364 | 12.4 | 18:45 | 7 | 3 | 3 | 6 | +2 | 2 | 29 | 10.3 | 19:02 |
| 2009-10 | Olympics | USA | 6 | 4 | 4 | 8 | ||||||||||||||
| 2009-10 | NHL | New Jersey Devils | 81 | 38 | 44 | 82 | +24 | 32 | 347 | 11.0 | 19:46 | 5 | 1 | 3 | 4 | 20 | 5.0 | 20:44 | ||
| 2010-11 | NHL | New Jersey Devils | 13 | 3 | 3 | 6 | -1 | 6 | 49 | 6.1 | 19:51 | |||||||||
| 2011-12 | NHL | New Jersey Devils | 82 | 31 | 38 | 69 | -5 | 32 | 293 | 10.6 | 21:29 | 24 | 8 | 7 | 15 | -8 | 4 | 87 | 9.2 | 20:53 |
| 2012-13 | NHL | Minnesota Wild | 48 | 18 | 20 | 38 | +2 | 16 | 182 | 9.9 | 20:40 | 5 | 1 | 1 | -7 | 2 | 17 | 5.9 | 21:24 | |
| 2013-14 | Olympics | USA | 6 | 1 | 0 | 1 | -1 | 11 | ||||||||||||
| 2013-14 | NHL | Minnesota Wild | 67 | 29 | 27 | 56 | +10 | 30 | 245 | 11.8 | 20:26 | 13 | 4 | 10 | 14 | -3 | 6 | 49 | 8.2 | 20:29 |
| 2014-15 | NHL | Minnesota Wild | 74 | 33 | 29 | 62 | +21 | 41 | 259 | 12.7 | 19:11 | 10 | 4 | 6 | 10 | 4 | 20 | 20.0 | 18:53 | |
| 2015-16 | NHL | Minnesota Wild | 70 | 25 | 28 | 53 | -3 | 36 | 234 | 10.7 | 19:18 | |||||||||
| 2016-17 | WCup | USA | 3 | 0 | 1 | 1 | -2 | 4 | ||||||||||||
| 2016-17 | NHL | Minnesota Wild | 69 | 19 | 23 | 42 | -3 | 30 | 194 | 9.8 | 17:26 | 5 | 2 | 1 | 3 | -4 | 8 | 19 | 10.5 | 19:28 |
| 2017-18 | AHL | Iowa Wild | 1 | 0 | 1 | 1 | ||||||||||||||
| 2017-18 | NHL | Minnesota Wild | 42 | 15 | 9 | 24 | 14 | 119 | 12.6 | 17:05 | 3 | 3 | 3 | 2 | 5 | 60.0 | 16:56 | |||
| 2018-19 | NHL | Minnesota Wild | 74 | 28 | 33 | 61 | -2 | 26 | 229 | 12.2 | 18:40 | |||||||||
| 2019-20 | NHL | Minnesota Wild | 69 | 25 | 21 | 46 | -11 | 8 | 155 | 16.1 | 17:12 | 4 | 3 | 3 | +2 | 2 | 6 | 0.0 | 17:44 | |
| 2020-21 | NHL | Minnesota Wild | 45 | 7 | 11 | 18 | +7 | 6 | 90 | 7.8 | 13:57 | 4 | 2 | 1 | 3 | -3 | 5 | 40.0 | 13:42 | |
| 2021-22 | NHL | New York Islanders | 82 | 15 | 20 | 35 | -2 | 28 | 138 | 10.9 | 15:17 | |||||||||
| 2022-23 | NHL | New York Islanders | 82 | 21 | 13 | 34 | +7 | 24 | 182 | 11.5 | 16:09 | 6 | -2 | 2 | 11 | 0.0 | 14:57 | |||
| 2023-24 | NHL | Colorado Avalanche | 30 | 5 | 5 | 10 | -7 | 8 | 50 | 10.0 | 12:58 | 11 | 2 | 1 | 3 | -1 | 19 | 10.5 | 14:35 | |
| NHL Career | 1254 | 434 | 455 | 889 | +76 | 444 | 3776 | 11.5 | 17:49 | 122 | 39 | 44 | 83 | -25 | 44 | 373 | 10.4 | 18:33 | ||