
 Sam Bennett
| Position | Center / Left Wing | Current Team | Florida Panthers |
| Shoots | Left | Current Contract | 8 years ($8.0M CapHit) |
| Height | 6'1" | Expires | 2032-33 |
| Weight (lbs) | 193 | Expiry Age (Jun 30) | 37 |
| Age (DOB) | 30 (June 20, 1996) | Expiry Status | UFA |
| Drafted | 2014, Round 1, Overall 4 (CGY) |
| Date | Team | Transaction | |
|---|---|---|---|
| Jun 27, 2025 | Florida Panthers | Signed 8 years @ $8.000M AAV starting in 2025-26 | |
| Jul 26, 2021 | Florida Panthers | Signed 4 years @ $4.425M AAV starting in 2021-22 | |
| Jul 24, 2019 | Calgary Flames | Signed 2 years @ $2.550M AAV starting in 2019-20 | |
| Sep 6, 2017 | Calgary Flames | Signed 2 years @ $1.950M AAV starting in 2017-18 | |
| Jul 26, 2014 | Calgary Flames | Signed to an entry level contract. |
Player Card(s)
URL: https://thestanleycap.com/cdn/player_cards/20252026/sam-bennett-8477935.png

URL: https://thestanleycap.com/cdn/player_cards/20242025/sam-bennett-8477935.png

URL: https://thestanleycap.com/cdn/player_cards/20232024/sam-bennett-8477935.png
About Player Cards
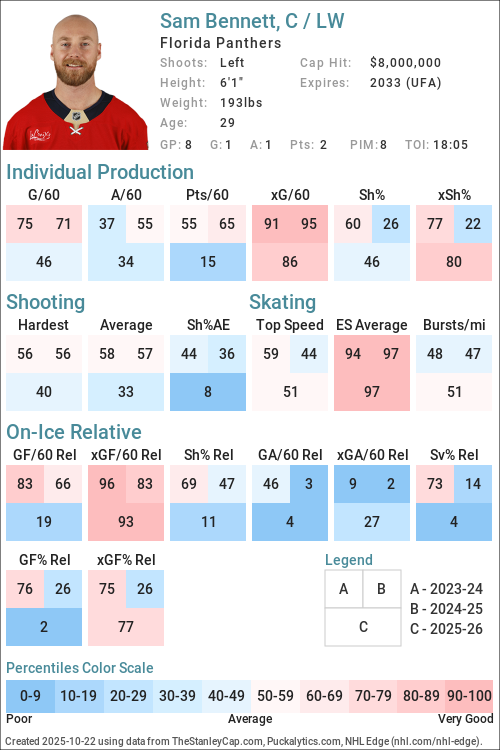
Player cards present an infographic of a players performance using a series of Player Archetypes developed for Puckalytics.com and TheStanleyCap.com. The boxes in the rink image show the archetype ratings for the season specified in the card while the graphs to the right show the five-year trends for those archetypes.
Except for Faceoffs, the values shown are the players z-score (standard deviation from the mean) for the specific metric used to calculate the archetype values. When calculating z-scores forwards were compared to forwards and defensemen were compared to defensemen. Positive values indicate the player is above average and shaded in blue, while negative values indicate the player is below average and shaded in pink. The five year trend charts show a range of -4.0 to 4.0.
The value shown for Faceoffs is the faceoff winning percentage rather than their z-score with winning percentages below 50 in pink shades and above 50 in blue shades.
All archetypes are 5v5 except 5v4 TOI, 4v5 TOI, Skating (even strength) and Faceoffs (all situations). Archetypes use regular season data only.
Archetypes Summary
- Sniper - Measures the to score above the expected goal rate.
- Rebound - Measures the percent of a players shot attempts that come from rebounds (forwards only).
- 5v4 TOI - Powerplay ice time, calculated as the percentage of his teams 5v4 ice time that the player was on the ice for.
- Shooter - Measures whether a players points come from shots (goals or assists on rebounds from his shots).
- Producer - Measures a players ability to produce goals and assists, adjusted for quality of teammates.
- Playmaker - Measures whether a players points come from passes.
- Drive - Measures a players ability to drive puck possession and generate shot attempts for his team.
- Rush - Measures the percent of a players shot attempts that come from rush plays
- Possession - An indicator of a players ability to improve his teams puck possession game.
- Faceoffs - Faceoff Winning Percentage (min. 75 faceoffs taken).
- 5v5 TOI - The percentage of his teams 5v5 TOI that the player was on the ice for.
- Suppress - Measures a players ability to suppress opponent puck possession and shot attempts against.
- Skating - An indicator of a players skating ability, or speed bursts above 20mph per mile skated.
- Defend - An indicator of a players ability to suppress shot quality against.
- 4v5 TOI - Penalty Kill ice time, calculated as the percentage of his teams 4v5 ice time that the player was on the ice for.
Data Sources
- Salary data is from TheStanleyCap.com
- Skating data is from NHL Edge
- Other statistics are from Puckalytics.com and derived from data from NHL.com
Terms of Use
You are free to use include player cards in written articles, share on social media, or on other public websites under the following conditions:
- You credit TheStanleyCap.com as the source and provide a link back to TheStanleyCap.com or this player page.
- You do not mass copy/duplicate/publish dozens or hundreds of player cards. A few, or a handful for a written article is fine. Be reasonable. Fair use rules apply.
- If you are a high-traffic website you must download and host the image(s) on your site rather than overload TheStanleyCap servers with traffic.
Note: Player cards will update daily throughout the season so if you want to include snapshot then you must download the image.
If you have any questions, send an e-mail to the e-mail address at the top of this page.
Read Introducing Player Archetypes on HockeyAnalysis.com for more details on archetype calculations.
Core Archetypes
| Season | Team(s) | GP | TOI | Producer | Playmaker | Shooter | Sniper | Rebound | Rush | Skating | Defend |
|---|---|---|---|---|---|---|---|---|---|---|---|
| 2015-16 | CGY | 77 | 0.31 | -0.40 | 0.79 | 0.86 | 0.29 | 0.51 | - | 0.69 | |
| 2016-17 | CGY | 81 | -0.18 | 0.07 | -0.45 | -0.54 | 0.61 | -0.22 | - | -1.57 | |
| 2017-18 | CGY | 82 | 0.11 | -0.40 | 0.43 | -0.86 | 0.19 | -0.03 | - | -0.17 | |
| 2018-19 | CGY | 71 | -0.26 | -0.14 | -0.34 | -0.70 | 1.57 | -0.56 | - | -1.03 | |
| 2019-20 | CGY | 52 | -0.73 | -1.31 | 0.77 | 0.31 | 0.24 | 0.51 | - | 1.85 | |
| 2020-21 | CGY, FLA | 48 | 1.61 | 2.21 | -0.16 | -0.48 | 0.72 | 1.15 | - | -1.88 | |
| 2021-22 | FLA | 71 | -0.10 | -1.14 | 1.37 | 0.51 | -0.37 | -0.12 | -0.65 | -0.13 | |
| 2022-23 | FLA | 63 | 0.17 | 0.74 | -0.56 | -1.00 | 1.19 | -1.35 | -0.30 | -0.04 | |
| 2023-24 | FLA | 69 | -0.34 | -0.64 | 0.10 | -0.13 | -1.13 | -0.49 | -0.21 | 0.62 | |
| 2024-25 | FLA | 76 | 0.27 | -0.20 | 0.44 | -0.33 | 0.74 | -1.31 | -0.26 | -1.00 | |
| 2025-26 | FLA | 76 | 0.45 | -0.44 | 1.02 | 0.37 | -0.38 | -0.43 | -0.56 | 0.06 |
Situational and Secondary Archetypes
| Season | Team(s) | GP | TOI | 5v5 TOI | 5v4 TOI | 4v5 TOI | Possession | Drive | Suppress | Faceoffs |
|---|---|---|---|---|---|---|---|---|---|---|
| 2015-16 | CGY | 77 | 0.22 | -0.16 | -1.92 | -0.32 | -0.08 | -0.56 | 46.1 | |
| 2016-17 | CGY | 81 | 0.17 | -0.81 | -0.44 | -0.34 | -0.61 | 0.30 | 46.1 | |
| 2017-18 | CGY | 82 | -0.03 | -0.78 | -0.99 | -0.45 | -0.33 | -0.42 | 54.3 | |
| 2018-19 | CGY | 71 | -0.37 | -0.51 | -1.71 | -0.18 | 0.51 | -0.94 | 55.6 | |
| 2019-20 | CGY | 52 | -0.57 | -1.17 | -1.83 | -0.41 | -0.27 | -0.39 | 51.7 | |
| 2020-21 | CGY, FLA | 48 | -0.03 | -1.07 | -0.78 | 0.63 | 0.47 | 0.55 | 47.5 | |
| 2021-22 | FLA | 71 | 0.62 | 0.10 | -0.85 | -0.27 | 0.32 | -0.92 | 46.9 | |
| 2022-23 | FLA | 63 | 0.90 | -0.24 | -0.34 | 1.02 | 1.66 | -0.40 | 47.0 | |
| 2023-24 | FLA | 69 | 0.74 | -0.18 | -1.48 | 0.30 | 1.45 | -1.50 | 45.5 | |
| 2024-25 | FLA | 76 | 0.98 | 0.26 | -2.03 | -0.46 | 0.90 | -1.95 | 46.2 | |
| 2025-26 | FLA | 76 | 0.78 | 0.78 | -0.86 | 0.25 | 1.12 | -1.10 | 47.6 |
5v5 Individual Stats
| Season | Team(s) | GP | TOI | G/60 | A/60 | Pts/60 | xG/60 | GAE/60 | Sh% | xSh% | Sh%AE | %SA Rush | %SA Reb. |
|---|---|---|---|---|---|---|---|---|---|---|---|---|---|
| 2015-16 | CGY | 77 | 946:48 | 0.82 | 0.76 | 1.58 | 0.65 | 0.17 | 12.75 | 10.11 | 2.64 | 5.04 | 5.76 |
| 2016-17 | CGY | 81 | 977:54 | 0.49 | 0.74 | 1.23 | 0.62 | -0.13 | 7.55 | 9.56 | -2.01 | 3.57 | 6.43 |
| 2017-18 | CGY | 82 | 968:05 | 0.62 | 0.81 | 1.43 | 0.88 | -0.26 | 7.09 | 10.05 | -2.96 | 3.90 | 5.37 |
| 2018-19 | CGY | 71 | 785:50 | 0.69 | 0.92 | 1.60 | 0.88 | -0.19 | 9.28 | 11.82 | -2.55 | 2.96 | 8.89 |
| 2019-20 | CGY | 52 | 580:27 | 0.83 | 0.31 | 1.14 | 0.76 | 0.07 | 11.94 | 10.94 | 1.00 | 4.95 | 6.93 |
| 2020-21 | CGY | 38 | 440:30 | 0.54 | 1.09 | 1.63 | 0.75 | -0.20 | 6.67 | 9.14 | -2.47 | 5.00 | 6.25 |
| 2020-21 | FLA | 10 | 120:27 | 1.49 | 3.49 | 4.98 | 1.57 | -0.08 | 12.00 | 12.65 | -0.65 | 9.09 | 12.12 |
| 2020-21 | CGY, FLA | 48 | 560:57 | 0.75 | 1.60 | 2.35 | 0.92 | -0.18 | 8.24 | 10.17 | -1.94 | 6.19 | 7.96 |
| 2021-22 | FLA | 71 | 926:46 | 1.23 | 0.78 | 2.01 | 1.03 | 0.20 | 10.92 | 9.15 | 1.77 | 3.79 | 5.21 |
| 2022-23 | FLA | 63 | 817:22 | 0.66 | 1.32 | 1.98 | 1.09 | -0.43 | 6.43 | 10.63 | -4.20 | 1.10 | 10.99 |
| 2023-24 | FLA | 69 | 893:48 | 0.87 | 0.81 | 1.68 | 0.91 | -0.03 | 10.92 | 11.34 | -0.42 | 2.84 | 4.55 |
| 2024-25 | FLA | 76 | 1045:31 | 0.80 | 0.92 | 1.72 | 0.94 | -0.13 | 8.19 | 9.55 | -1.36 | 0.43 | 9.48 |
| 2025-26 | FLA | 76 | 993:53 | 1.03 | 0.97 | 1.99 | 0.96 | 0.07 | 12.50 | 11.65 | 0.85 | 1.97 | 6.90 |
5v5 On Ice Stats
| Season | Team(s) | GP | TOI | SAF/60 | GF/60 | xGF/60 | SAA/60 | GA/60 | xGA/60 | GF% | xGF% | xGF Rel | xGA Rel | xGF% Rel |
|---|---|---|---|---|---|---|---|---|---|---|---|---|---|---|
| 2015-16 | CGY | 77 | 946:48 | 38.21 | 2.28 | 2.22 | 41.64 | 2.41 | 2.17 | 48.65 | 50.61 | 0.07 | -0.12 | 2.11 |
| 2016-17 | CGY | 81 | 977:54 | 36.87 | 1.66 | 1.87 | 38.47 | 2.64 | 2.00 | 38.57 | 48.25 | -0.34 | -0.26 | -1.15 |
| 2017-18 | CGY | 82 | 968:05 | 46.79 | 1.80 | 2.62 | 43.20 | 2.60 | 2.38 | 40.85 | 52.43 | 0.15 | 0.13 | 0.15 |
| 2018-19 | CGY | 71 | 785:50 | 46.57 | 2.60 | 2.74 | 41.99 | 2.75 | 2.42 | 48.57 | 53.07 | 0.06 | 0.01 | 0.52 |
| 2019-20 | CGY | 52 | 580:27 | 41.86 | 1.76 | 2.54 | 43.62 | 1.86 | 2.28 | 48.57 | 52.71 | 0.09 | -0.08 | 1.72 |
| 2020-21 | CGY | 38 | 440:30 | 42.36 | 2.32 | 2.25 | 38.82 | 4.09 | 2.37 | 36.17 | 48.73 | -0.15 | 0.17 | -3.47 |
| 2020-21 | FLA | 10 | 120:27 | 56.79 | 4.98 | 3.94 | 31.38 | 0.50 | 1.43 | 90.91 | 73.45 | 0.76 | -0.97 | 16.33 |
| 2020-21 | CGY, FLA | 48 | 560:57 | 45.46 | 2.89 | 2.61 | 37.22 | 3.32 | 2.16 | 46.55 | 54.70 | 0.05 | -0.07 | 1.32 |
| 2021-22 | FLA | 71 | 926:46 | 50.69 | 3.69 | 3.54 | 39.95 | 2.46 | 2.78 | 60.00 | 56.01 | 0.22 | 0.42 | -2.42 |
| 2022-23 | FLA | 63 | 817:22 | 53.51 | 3.23 | 3.73 | 43.16 | 2.57 | 2.83 | 55.70 | 56.87 | 0.91 | 0.25 | 4.65 |
| 2023-24 | FLA | 69 | 893:48 | 51.56 | 3.02 | 3.17 | 42.69 | 1.88 | 2.50 | 61.64 | 55.90 | 0.80 | 0.42 | 2.68 |
| 2024-25 | FLA | 76 | 1045:31 | 48.72 | 2.53 | 2.89 | 42.87 | 2.81 | 2.60 | 47.31 | 52.68 | 0.37 | 0.56 | -2.65 |
| 2025-26 | FLA | 76 | 993:53 | 44.85 | 3.08 | 2.92 | 42.62 | 3.02 | 2.90 | 50.50 | 50.17 | 0.45 | 0.51 | -0.61 |
NHL Edge Stats
| Skating | Shooting | Zone Time | |||||||||||
|---|---|---|---|---|---|---|---|---|---|---|---|---|---|
| Season | GP | Top Speed | Bursts>20/mi | Avg. Speed | Top Speed | Avg. Speed | %Long Range | %Mid Range | %High Danger | ES DZ% | ES NZ% | ES OZ% | |
| This table is for Basic and Premium subscribers only. To view please login to and/or subscribe to one of our subscription plans. | |||||||||||||
Legend
| Percentile 0-25 | Percentile 25-50 | Percentile 50-75 | Percentile 75-100 |
5v5 Lines
| Season | Teammate | Teammate | Team | TOI | GF/60 | GA/60 | GF% | xGF/60 | xGA/60 | xGF% | xGF Rel | xGA Rel | xGF% Rel |
|---|
Glossary
| Type | Statistic | Definition |
|---|---|---|
| Individual | G/60 | Goals Against per 60 minutes. |
| Individual | A/60 | Assists per 60 minutes. |
| Individual | Pts/60 | Points per 60 minutes. |
| Individual | xG/60 | Expected Goals per 60 minutes. |
| Individual | GAE/60 | Goals Above Expected (G/60 - xG/60). |
| Individual | Sh% | Shooting Percentage. |
| Individual | xSh% | Expected Shooting Percentage. |
| Individual | Sh%AE | Shooting percentage above expected (Sh% - xSh%). |
| Individual | %SA Rush | Percentage of shot attempts determined to be on the rush. |
| Individual | %SA Reb. | Percentage of shot attempts determined to be from rebounds. |
| On Ice | SAF/60 | Shot Attempts For per 60 minutes. |
| On Ice | GF/60 | Goals For per 60 minutes. |
| On Ice | xGF/60 | Expected Goals For per 60 minutes. |
| On Ice | SAA/60 | Shot Attempts Against per 60 minutes (lower is better). |
| On Ice | GA/60 | Goals Against per 60 minutes (lower is better). |
| On Ice | xGA/60 | Expected Goals Against per 60 minutes (lower is better). |
| On Ice | GF% | Goals For Percentage = Goals For / (Goals For + Goals Against) |
| On Ice | xGF% | Expected Goals For Percentage = Expected Goals For / (Expected Goals For + Expected Goals Against) |
| On Ice | xGF Rel | xGF/60 when On Ice - xGF/60 when not On Ice. |
| On Ice | xGA Rel | xGA/60 when On Ice - xGA/60 when not On Ice (lower is better). |
| On Ice | xGF% Rel | xGF% when On Ice - xGF% when not On Ice. |
News and Opinions
-
Former Calgary Flames draft picks to win their first Stanley Cup elsewhere at The Win Column (Wed Jun 24, 2026)
-
Hurricanes star Jordan Staal wins Conn Smythe Trophy as Stanley Cup playoff MVP at Yahoo Sports NHL (Mon Jun 15, 2026)
-
Selon Dany Dubé, le CH a besoin d’un centre comme Sam Bennett at Dans Les Coulisses (Sat Jun 13, 2026)
-
Senators Summer: Could Mason McTavish Be The Next Sam Bennett Story? at Yahoo Sports NHL (Mon Jun 1, 2026)
-
No, Connor Zary does not need a fresh start elsewhere at The Win Column (Fri May 29, 2026)
-
Brad Marchand, Sam Bennett Star In New National Commercial That Debuted During Stanley Cup Playoffs at Yahoo Sports NHL (Mon Apr 20, 2026)
-
Sam Bennett Set To Return To Panthers Lineup Against Senators Following The Birth Of His Son at Yahoo Sports NHL (Tue Mar 31, 2026)
-
3 Flames first-round picks combining on a goal-scoring play is incredibly rare at Flames Nation (Sat Mar 28, 2026)
-
Seth Jones, Sam Bennett To Return From Injury, Nolan Foote Making Panthers Debut In Vancouver at Yahoo Sports NHL (Tue Mar 17, 2026)
-
Tom Wilson on being put on the ‘Fine Line’ with Brad Marchand and Sam Bennett: ‘I think it’s clear what our job is — to create chaos’ at Russian Machine Never Breaks (Sat Feb 21, 2026)
-
Sam Bennett fait du Sam Bennett et prend une punition inutile qui donne l'avance à la Finlande at HABSolument Fan (Fri Feb 20, 2026)
-
We now know what Sam Bennett shouted at Nico Hischier after no high-sticking penalty at Habs Fanatics (Fri Feb 13, 2026)
-
Matthew Tkachuk croit que le Canada est meilleur avec Bennett au lieu de Cirelli at Dans Les Coulisses (Mon Feb 9, 2026)
-
Team Canada practice reveals surprising lineup decision involving Sam Bennett and Seth Jarvis at Habs Fanatics (Mon Feb 9, 2026)
-
Sidney Crosby picks Tom Wilson to lead Team Canada in penalty minutes at the 2026 Winter Olympics at Russian Machine Never Breaks (Sun Feb 8, 2026)
-
Sam Bennett joins the Olympic Team Canada roster at The Rat Trick (Thu Feb 5, 2026)
-
Marchand Scores Shootout Winner, Panthers Pick Up Two Crucial Points Against Boston at Yahoo Sports NHL (Thu Feb 5, 2026)
-
Canada adds Bennett to replace injured Cirelli at ESPN (Wed Feb 4, 2026)
-
The Hockey News Big Show: How Much Will Sam Bennett Help Team Canada? at The Hockey News (Wed Feb 4, 2026)
-
Sam Bennett To Play Against Bruins, Anton Lundell Probable, Brad Marchand Remains Out at Yahoo Sports NHL (Wed Feb 4, 2026)
-
Deen’s Daily: O’Connor Update; Bennett Makes Team Canada After All; Sherwood Debut Tonight? at Colorado Hockey Now (Wed Feb 4, 2026)
-
Florida To Host Wild Card-Holding Bruins Knowing They Can't Keep Letting Points Slip Away at Yahoo Sports NHL (Wed Feb 4, 2026)
-
NHL Notebook: Sam Bennett replaces Anthony Cirelli for Team Canada at 2026 Winter Olympics at Canucks Army (Tue Feb 3, 2026)
-
Reports: Sam Bennett Replaces Anthony Cirelli On Canada's Olympic Team at The Hockey News (Tue Feb 3, 2026)
-
Sam Bennett was left out of the 2026 Olympic Team Canada roster at The Rat Trick (Sat Jan 10, 2026)
-
Panthers Lead League in Olympic Picks, but Bennett Snub Casts Shadow at The Hockey Writers (Fri Jan 9, 2026)
-
Panthers’ Sam Bennett Being Snubbed From Canada’s Olympic Roster Is Disrespectful at The Hockey Writers (Thu Jan 8, 2026)
-
Olympic hockey roster grades for U.S., Canada, Finland, plus snubs and surprises at ESPN (Fri Jan 2, 2026)
-
Fans, Media React To Canada's Olympic Men's Roster: 'Not Taking Bedard Is An Absolute Joke' at The Hockey News (Wed Dec 31, 2025)
-
It goes to eleven in Panthers 3-2 win over Kings at Litter Box Cats (Thu Dec 18, 2025)
-
Pickups: Sam Bennett, Jason Zucker heating up in December at ESPN (Mon Dec 8, 2025)
-
Panthers end slump with 7-6 overtime win over Blue Jackets at Litter Box Cats (Sun Dec 7, 2025)
-
Throwback Thursday: Looking at the Sam Bennett and Matthew Tkachuk trades with the Panthers at Flames Nation (Thu Nov 27, 2025)
-
The Calgary Flames could be turning Connor Zary into the next Sam Bennett at The Win Column (Thu Nov 13, 2025)
-
The Calgary Flames could be turning Connor Zary into the next Sam Bennett at The Win Column (Thu Nov 13, 2025)
-
2014 NHL Draft Top 10: Where Are They Now? at The Hockey Writers (Mon Nov 10, 2025)
-
Panthers’ Sam Bennett Is Struggling to Start the Season at The Hockey Writers (Wed Nov 5, 2025)
-
Panthers kick off road trip with frustrating 7-3 loss in Anaheim at Yahoo Sports NHL (Wed Nov 5, 2025)
-
Thoughts on the Panthers through their First 12 Games at The Puck Under the Sun (Sun Nov 2, 2025)
-
Sam Bennett’s positive impact on the South Florida community at The Rat Trick (Fri Oct 24, 2025)
-
Panthers see streak end with 5-2 loss to Flyers at Litter Box Cats (Tue Oct 14, 2025)
-
Injuries aside, Panthers remain Leafs' biggest Atlantic Division threat at Editor in Leaf (Mon Oct 6, 2025)
-
Aleksander Barkov injury could force Panthers to make big move at The Rat Trick (Sat Sep 27, 2025)
-
Anthony Stolarz outlines what he’s looking for with next contract, clash with Sam Bennett and more at The Leafs Nation (Tue Sep 16, 2025)
-
Panthers’ Sam Bennett trolls Oilers during day with Stanley Cup at Oilers Nation (Sat Aug 23, 2025)
-
Panthers' Sam Bennett and Aleksander Barkov Feature In NHL Network's Rankings at Yahoo Sports NHL (Thu Aug 21, 2025)
-
Saturday Caterwaul: Florida Panthers Open Forum at Litter Box Cats (Sat Aug 2, 2025)
-
Pires contrats de la LNH : Celui de Sam Bennett en fait partie selon The Athletic at Dans Les Coulisses (Thu Jul 31, 2025)
-
What Could Nico Hischier’s Next Contract Look Like And Why the Devils Have No Choice But To Pay It at All About the Jersey (Wed Jul 30, 2025)
-
Rethinking the Maple Leafs After Marner at The Hockey Writers (Mon Jul 28, 2025)
-
Zachary Bolduc pourrait être le Sam Bennett du Canadien at Dans Les Coulisses (Wed Jul 23, 2025)
-
Sam Bennett, Sasha Barkov have names added to Hall of Fame hardware at Yahoo Sports NHL (Sat Jul 19, 2025)
-
Panthers, Bennett Agree On 8-Year, $64 Million Extension at The Rat Trick (Fri Jun 27, 2025)
-
Florida Panthers Could Sacrifice Ekblad to Sign Bennett, Marchand at The Rat Trick (Wed Jun 25, 2025)
-
Looking at the Panthers 2025 Offseason at The Puck Under the Sun (Mon Jun 23, 2025)
-
How these two playoff performances can help Senators sign this Panthers defenseman at SenShot (Mon Jun 16, 2025)
-
Sam Bennett Contract Extension Take Positive Turn at The Rat Trick (Fri Jun 13, 2025)
-
Stanley Cup Final Game 2 Preview: How To Watch, Odds, Injuries, Notes, and Keys at The Rat Trick (Fri Jun 6, 2025)
-
3 dream Sharks acquisitions that could make an impact next season at Blades of Teal (Wed Jun 4, 2025)
-
3 Colorado Avalanche free agent targets to reach another level in 2026 at Mile High Sticking (Wed Jun 4, 2025)
-
Stanley Cup Final Game 1 Preview: How To Watch, Odds, Injuries, Notes, and Keys at The Rat Trick (Wed Jun 4, 2025)
-
2025 Stanley Cup Final Preview: Can Florida Go Back-To-Back? at The Rat Trick (Tue Jun 3, 2025)
-
NHL free agency: Canucks need Sam Bennett, but only at the right price at The Canuck Way (Sat May 24, 2025)
-
Panthers vs. Hurricanes Game 2 Preview: How To Watch, Odds, Injuries, Notes, and Keys at The Rat Trick (Wed May 21, 2025)
-
Former first-round Calgary Flame picks in the Stanley Cup Final at Flame for Thought (Sun Jun 9, 2024)
Current Contract
Sam Bennett signed an $64,000,000 8-year contract with the Florida Panthers and General Manager Bill Zito on June 27, 2025 with an AAV of $8,000,000. This contract will start in 2025-26 and end after the 2032-33 season. In the first season of the contract the cap hit was equivalent to 8.38% of the salary cap.
Standard Contract (UFA) ( ) (0 ratings)
Sam Bennett signed a $17,700,000 4-year contract with the Florida Panthers and General Manager Bill Zito on July 26, 2021 with an AAV of $4,425,000. This contract will start in 2021-22 and end after the 2024-25 season. In the first season of the contract the cap hit was equivalent to 5.43% of the salary cap.
Standard Contract (RFA) ( ) (0 ratings)
| Season | Age* | Clause | Cap Hit | AAV | Perf. Bonus | Sign. Bonus | Salary | Compensation | Minors Salary | Status | |
|---|---|---|---|---|---|---|---|---|---|---|---|
| 2021-22 | 25 | $4,425,000 | $4,425,000 | - | $1,000,000 | $1,925,000 | $2,925,000 | $2,925,000 | RFA-arb | ||
| 2022-23 | 26 | $4,425,000 | $4,425,000 | - | - | $3,425,000 | $3,425,000 | $3,425,000 | UFA | ||
| 2023-24 | 27 | $4,425,000 | $4,425,000 | - | - | $6,350,000 | $6,350,000 | $6,350,000 | UFA | ||
| 2024-25 | 28 | $4,425,000 | $4,425,000 | - | - | $5,000,000 | $5,000,000 | $5,000,000 | UFA | ||
| Total | - | $1,000,000 | $16,700,000 | $17,700,000 | $17,700,000 |
Sam Bennett signed a $5,100,000 2-year contract with the Calgary Flames and General Manager Brad Treliving on July 24, 2019 with an AAV of $2,550,000. This contract will start in 2019-20 and end after the 2020-21 season. In the first season of the contract the cap hit was equivalent to 3.13% of the salary cap.
Standard Contract (RFA) ( ) (0 ratings)
| Season | Age* | Clause | Cap Hit | AAV | Perf. Bonus | Sign. Bonus | Salary | Compensation | Minors Salary | Status | |
|---|---|---|---|---|---|---|---|---|---|---|---|
| 2019-20 | 23 | $2,550,000 | $2,550,000 | - | - | $2,550,000 | $2,550,000 | $2,550,000 | RFA-arb | ||
| 2020-21 | 24 | $2,550,000 | $2,550,000 | - | - | $2,550,000 | $2,550,000 | $2,550,000 | RFA-arb | ||
| Total | - | - | $5,100,000 | $5,100,000 | $5,100,000 |
Sam Bennett signed a $3,900,000 2-year contract with the Calgary Flames and General Manager Brad Treliving on September 6, 2017 with an AAV of $1,950,000. This contract will start in 2017-18 and end after the 2018-19 season. In the first season of the contract the cap hit was equivalent to 2.60% of the salary cap.
Standard Contract (RFA) ( ) (0 ratings)
| Season | Age* | Clause | Cap Hit | AAV | Perf. Bonus | Sign. Bonus | Salary | Compensation | Minors Salary | Status | |
|---|---|---|---|---|---|---|---|---|---|---|---|
| 2017-18 | 21 | $1,950,000 | $1,950,000 | - | - | $1,950,000 | $1,950,000 | $1,950,000 | RFA | ||
| 2018-19 | 22 | $1,950,000 | $1,950,000 | - | - | $1,950,000 | $1,950,000 | $1,950,000 | RFA-arb | ||
| Total | - | - | $3,900,000 | $3,900,000 | $3,900,000 |
Sam Bennett signed a $2,775,000 3-year contract with the Calgary Flames and General Manager Brad Treliving on July 26, 2014 with an AAV of $925,000. This contract will start in 2014-15 and end after the 2016-17 season. In the first season of the contract the cap hit was equivalent to 1.34% of the salary cap.
Entry Level Contract ( ) (0 ratings)
| Season | Age* | Clause | Cap Hit | AAV | Perf. Bonus | Sign. Bonus | Salary | Compensation | Minors Salary | Status | |
|---|---|---|---|---|---|---|---|---|---|---|---|
| 2014-15 | 18 | $925,000 | $3,225,000 | $2,300,000 | $92,500 | $832,500 | $925,000 | $70,000 | ELC | ||
| 2015-16 | 19 | $925,000 | $3,225,000 | $2,300,000 | $92,500 | $832,500 | $925,000 | $70,000 | ELC | ||
| 2016-17 | 20 | $925,000 | $3,225,000 | $2,300,000 | $92,500 | $832,500 | $925,000 | $70,000 | ELC | ||
| Total | $6,900,000 | $277,500 | $2,497,500 | $2,775,000 | $210,000 |
Career Statistics
| Regular Season | Playoffs | |||||||||||||||||||
|---|---|---|---|---|---|---|---|---|---|---|---|---|---|---|---|---|---|---|---|---|
| Season | League | Team | GP | G | A | Pts | +/- | PIM | Shots | Sh% | TOI/G | GP | G | A | Pts | +/- | PIM | Shots | Sh% | TOI/G |
| 2008-09 | QC Int PW | York Simcoe Peewee | 7 | 6 | 7 | 13 | ||||||||||||||
| 2011-12 | GTHL | Tor. Marlboros | 37 | 33 | 36 | 69 | 34 | |||||||||||||
| 2012-13 | OHL | Kingston | 60 | 18 | 22 | 40 | -2 | 87 | 4 | 3 | 3 | -9 | 2 | |||||||
| 2013-14 | OHL | Kingston | 57 | 36 | 55 | 91 | +34 | 118 | 7 | 5 | 4 | 9 | +2 | 18 | ||||||
| 2014-15 | NHL | Calgary Flames | 1 | 0 | 1 | 1 | -1 | 1 | 0.0 | 16:00 | 11 | 3 | 1 | 4 | -3 | 8 | 20 | 15.0 | 14:01 | |
| 2014-15 | OHL | Kingston | 11 | 11 | 13 | 24 | +4 | 14 | 4 | 3 | 3 | -4 | 4 | |||||||
| 2015-16 | NHL | Calgary Flames | 77 | 18 | 18 | 36 | -11 | 37 | 136 | 13.2 | 15:09 | |||||||||
| 2016-17 | NHL | Calgary Flames | 81 | 13 | 13 | 26 | -16 | 75 | 122 | 10.7 | 14:59 | 4 | 2 | 2 | -1 | 4 | 10 | 20.0 | 13:40 | |
| 2017-18 | NHL | Calgary Flames | 82 | 11 | 15 | 26 | -18 | 59 | 157 | 7.0 | 14:24 | |||||||||
| 2018-19 | NHL | Calgary Flames | 71 | 13 | 14 | 27 | -6 | 93 | 115 | 11.3 | 13:17 | 5 | 1 | 4 | 5 | 16 | 9 | 11.1 | 13:14 | |
| 2019-20 | NHL | Calgary Flames | 52 | 8 | 4 | 12 | -1 | 36 | 82 | 9.8 | 12:31 | 10 | 5 | 3 | 8 | +4 | 10 | 32 | 15.6 | 15:18 |
| 2020-21 | NHL | Calgary Flames | 38 | 4 | 8 | 12 | -14 | 19 | 67 | 6.0 | 13:28 | |||||||||
| 2020-21 | NHL | Florida Panthers | 10 | 6 | 9 | 15 | +12 | 33 | 39 | 15.4 | 18:04 | 5 | 1 | 4 | 5 | 8 | 18 | 5.6 | 20:55 | |
| 2021-22 | NHL | Florida Panthers | 71 | 28 | 21 | 49 | +27 | 74 | 241 | 11.6 | 16:57 | 10 | 1 | 2 | 3 | +1 | 12 | 29 | 3.4 | 16:46 |
| 2022-23 | NHL | Florida Panthers | 63 | 16 | 24 | 40 | +5 | 54 | 193 | 8.3 | 17:24 | 20 | 5 | 10 | 15 | +5 | 60 | 73 | 6.8 | 20:52 |
| 2023-24 | NHL | Florida Panthers | 69 | 20 | 21 | 41 | +17 | 100 | 171 | 11.7 | 16:37 | 19 | 7 | 7 | 14 | -1 | 12 | 38 | 18.4 | 16:04 |
| 2024-25 | 4 Nations | Canada | 3 | 1 | 0 | 1 | -1 | 5 | 9 | 11.0 | 12:03 | |||||||||
| 2024-25 | NHL | Florida Panthers | 76 | 25 | 26 | 51 | -15 | 90 | 241 | 10.4 | 17:27 | 23 | 15 | 7 | 22 | +6 | 48 | 69 | 21.7 | 17:34 |
| 2025-26 | NHL | Florida Panthers | 76 | 26 | 32 | 58 | -10 | 82 | 201 | 12.9 | 18:30 | |||||||||
| 2025-26 | OG | Canada | 5 | 0 | 1 | 1 | +2 | 6 | 8 | 0.0 | 9:55 | |||||||||
| NHL Career | 767 | 188 | 206 | 394 | -31 | 752 | 1766 | 10.6 | 15:42 | 107 | 40 | 38 | 78 | +11 | 178 | 298 | 13.4 | 17:04 | ||