
 Ryan Nugent-Hopkins
| Position | Left Wing / Center | Current Team | Edmonton Oilers |
| Shoots | Left | Current Contract | 8 years ($5.1M CapHit) |
| Height | 6'1" | Expires | 2028-29 |
| Weight (lbs) | 192 | Expiry Age (Jun 30) | 36 |
| Age (DOB) | 33 (Apr 12, 1993) | Expiry Status | UFA |
| Drafted | 2011, Round 1, Overall 1 (EDM) |
| Date | Team | Transaction | |
|---|---|---|---|
| Nov 29, 2025 | Edmonton Oilers | Activated from IR | |
| Nov 10, 2025 | Edmonton Oilers | Placed on IR | |
| Jun 29, 2021 | Edmonton Oilers | Signed 8 years @ $5.125M AAV starting in 2021-22 | |
| Sep 19, 2013 | Edmonton Oilers | Signed 7 years @ $6.000M AAV starting in 2014-15 | |
| Jul 2, 2011 | Edmonton Oilers | Signed to an entry level contract. |
Player Card(s)
URL: https://thestanleycap.com/cdn/player_cards/20252026/ryan-nugent-hopkins-8476454.png

URL: https://thestanleycap.com/cdn/player_cards/20242025/ryan-nugent-hopkins-8476454.png

URL: https://thestanleycap.com/cdn/player_cards/20232024/ryan-nugent-hopkins-8476454.png
About Player Cards
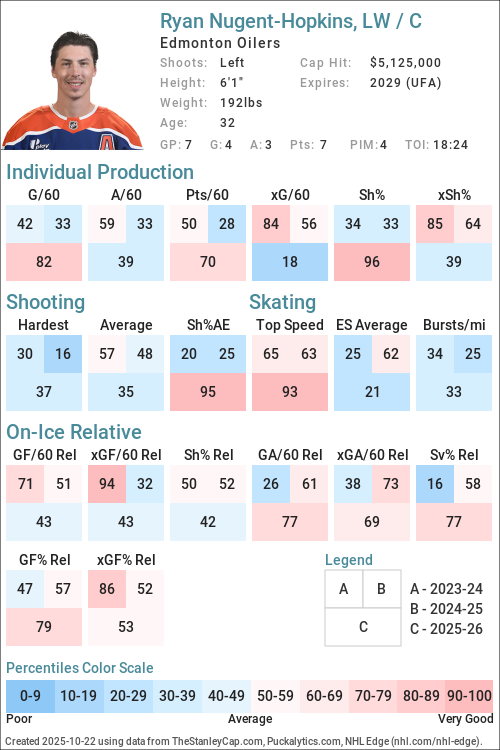
Player cards present an infographic of a players performance using a series of Player Archetypes developed for Puckalytics.com and TheStanleyCap.com. The boxes in the rink image show the archetype ratings for the season specified in the card while the graphs to the right show the five-year trends for those archetypes.
Except for Faceoffs, the values shown are the players z-score (standard deviation from the mean) for the specific metric used to calculate the archetype values. When calculating z-scores forwards were compared to forwards and defensemen were compared to defensemen. Positive values indicate the player is above average and shaded in blue, while negative values indicate the player is below average and shaded in pink. The five year trend charts show a range of -4.0 to 4.0.
The value shown for Faceoffs is the faceoff winning percentage rather than their z-score with winning percentages below 50 in pink shades and above 50 in blue shades.
All archetypes are 5v5 except 5v4 TOI, 4v5 TOI, Skating (even strength) and Faceoffs (all situations). Archetypes use regular season data only.
Archetypes Summary
- Sniper - Measures the to score above the expected goal rate.
- Rebound - Measures the percent of a players shot attempts that come from rebounds (forwards only).
- 5v4 TOI - Powerplay ice time, calculated as the percentage of his teams 5v4 ice time that the player was on the ice for.
- Shooter - Measures whether a players points come from shots (goals or assists on rebounds from his shots).
- Producer - Measures a players ability to produce goals and assists, adjusted for quality of teammates.
- Playmaker - Measures whether a players points come from passes.
- Drive - Measures a players ability to drive puck possession and generate shot attempts for his team.
- Rush - Measures the percent of a players shot attempts that come from rush plays
- Possession - An indicator of a players ability to improve his teams puck possession game.
- Faceoffs - Faceoff Winning Percentage (min. 75 faceoffs taken).
- 5v5 TOI - The percentage of his teams 5v5 TOI that the player was on the ice for.
- Suppress - Measures a players ability to suppress opponent puck possession and shot attempts against.
- Skating - An indicator of a players skating ability, or speed bursts above 20mph per mile skated.
- Defend - An indicator of a players ability to suppress shot quality against.
- 4v5 TOI - Penalty Kill ice time, calculated as the percentage of his teams 4v5 ice time that the player was on the ice for.
Data Sources
- Salary data is from TheStanleyCap.com
- Skating data is from NHL Edge
- Other statistics are from Puckalytics.com and derived from data from NHL.com
Terms of Use
You are free to use include player cards in written articles, share on social media, or on other public websites under the following conditions:
- You credit TheStanleyCap.com as the source and provide a link back to TheStanleyCap.com or this player page.
- You do not mass copy/duplicate/publish dozens or hundreds of player cards. A few, or a handful for a written article is fine. Be reasonable. Fair use rules apply.
- If you are a high-traffic website you must download and host the image(s) on your site rather than overload TheStanleyCap servers with traffic.
Note: Player cards will update daily throughout the season so if you want to include snapshot then you must download the image.
If you have any questions, send an e-mail to the e-mail address at the top of this page.
Read Introducing Player Archetypes on HockeyAnalysis.com for more details on archetype calculations.
Core Archetypes
| Season | Team(s) | GP | TOI | Producer | Playmaker | Shooter | Sniper | Rebound | Rush | Skating | Defend |
|---|---|---|---|---|---|---|---|---|---|---|---|
| 2015-16 | EDM | 55 | -0.26 | 0.31 | -0.72 | -0.01 | -1.25 | 0.02 | - | -0.30 | |
| 2016-17 | EDM | 82 | 0.31 | 0.57 | -0.33 | -0.43 | -1.25 | -0.30 | - | -0.27 | |
| 2017-18 | EDM | 62 | 0.63 | 0.29 | 0.35 | 0.38 | 0.26 | 0.78 | - | 0.19 | |
| 2018-19 | EDM | 82 | 0.12 | 0.02 | -0.02 | -0.09 | -0.08 | -0.09 | - | -0.38 | |
| 2019-20 | EDM | 65 | 1.32 | 0.25 | 1.24 | 0.84 | 0.15 | -0.24 | - | 1.57 | |
| 2020-21 | EDM | 52 | -1.16 | -0.99 | -0.59 | -0.87 | 0.48 | 0.81 | - | 0.04 | |
| 2021-22 | EDM | 63 | -0.69 | 0.13 | -1.06 | -0.75 | -0.16 | -0.09 | -0.52 | 0.80 | |
| 2022-23 | EDM | 82 | 0.39 | 0.33 | 0.00 | 0.53 | -0.12 | -0.33 | -0.59 | -0.32 | |
| 2023-24 | EDM | 80 | -0.57 | -0.37 | -0.55 | -1.02 | 0.96 | -0.01 | -0.54 | -0.97 | |
| 2024-25 | EDM | 78 | -0.98 | -0.75 | -0.67 | -0.56 | -0.17 | -0.23 | -0.73 | 0.22 | |
| 2025-26 | EDM | 72 | -0.71 | -0.14 | -0.87 | -0.55 | -0.60 | 0.80 | -0.88 | -0.08 |
Situational and Secondary Archetypes
| Season | Team(s) | GP | TOI | 5v5 TOI | 5v4 TOI | 4v5 TOI | Possession | Drive | Suppress | Faceoffs |
|---|---|---|---|---|---|---|---|---|---|---|
| 2015-16 | EDM | 55 | 1.23 | 0.67 | -0.48 | -0.79 | -0.26 | -1.25 | 44.8 | |
| 2016-17 | EDM | 82 | 0.45 | 0.03 | 0.87 | -0.19 | 0.18 | -0.69 | 43.8 | |
| 2017-18 | EDM | 62 | 0.72 | 0.05 | 0.47 | -0.67 | -0.46 | -0.60 | 48.8 | |
| 2018-19 | EDM | 82 | 0.90 | 1.65 | 0.45 | -1.11 | -0.64 | -0.84 | 45.1 | |
| 2019-20 | EDM | 65 | 0.97 | 2.12 | 0.53 | 0.50 | 0.93 | -0.58 | 50.7 | |
| 2020-21 | EDM | 52 | 1.03 | 2.38 | 0.87 | 0.67 | 0.68 | 0.28 | 45.6 | |
| 2021-22 | EDM | 63 | 0.33 | 1.94 | 0.89 | -1.94 | -1.43 | -1.53 | 40.7 | |
| 2022-23 | EDM | 82 | 0.69 | 1.71 | 0.53 | -0.44 | -0.21 | -0.46 | 45.2 | |
| 2023-24 | EDM | 80 | 0.65 | 1.59 | 0.46 | 0.99 | 1.12 | 0.23 | 48.0 | |
| 2024-25 | EDM | 78 | 0.24 | 1.46 | 0.94 | 0.06 | -0.17 | 0.28 | 48.5 | |
| 2025-26 | EDM | 72 | 0.38 | 1.82 | 0.03 | -1.10 | 0.54 | -2.48 | 47.4 |
5v5 Individual Stats
| Season | Team(s) | GP | TOI | G/60 | A/60 | Pts/60 | xG/60 | GAE/60 | Sh% | xSh% | Sh%AE | %SA Rush | %SA Reb. |
|---|---|---|---|---|---|---|---|---|---|---|---|---|---|
| 2015-16 | EDM | 55 | 790:59 | 0.46 | 0.99 | 1.44 | 0.48 | -0.02 | 8.22 | 8.67 | -0.45 | 4.08 | 2.04 |
| 2016-17 | EDM | 82 | 1063:38 | 0.56 | 0.90 | 1.47 | 0.70 | -0.13 | 6.85 | 8.47 | -1.62 | 3.41 | 2.27 |
| 2017-18 | EDM | 62 | 840:57 | 0.78 | 1.21 | 2.00 | 0.70 | 0.09 | 11.46 | 10.19 | 1.27 | 5.51 | 5.51 |
| 2018-19 | EDM | 82 | 1145:53 | 0.73 | 0.94 | 1.68 | 0.77 | -0.03 | 10.37 | 10.83 | -0.46 | 3.91 | 5.03 |
| 2019-20 | EDM | 65 | 892:37 | 1.01 | 1.28 | 2.29 | 0.78 | 0.23 | 13.04 | 10.13 | 2.92 | 3.33 | 6.67 |
| 2020-21 | EDM | 52 | 720:45 | 0.58 | 0.50 | 1.08 | 0.83 | -0.24 | 8.54 | 12.12 | -3.59 | 5.45 | 7.27 |
| 2021-22 | EDM | 63 | 804:45 | 0.45 | 1.04 | 1.49 | 0.63 | -0.18 | 6.98 | 9.76 | -2.78 | 3.85 | 5.77 |
| 2022-23 | EDM | 82 | 1079:30 | 0.89 | 1.28 | 2.17 | 0.80 | 0.09 | 13.79 | 12.41 | 1.39 | 3.12 | 6.88 |
| 2023-24 | EDM | 80 | 1072:57 | 0.62 | 1.01 | 1.62 | 0.88 | -0.27 | 8.73 | 12.53 | -3.80 | 3.85 | 10.99 |
| 2024-25 | EDM | 78 | 1010:52 | 0.53 | 0.71 | 1.25 | 0.67 | -0.13 | 8.91 | 11.13 | -2.22 | 2.07 | 6.90 |
| 2025-26 | EDM | 72 | 948:21 | 0.51 | 0.89 | 1.39 | 0.66 | -0.16 | 9.64 | 12.60 | -2.96 | 3.88 | 6.20 |
5v5 On Ice Stats
| Season | Team(s) | GP | TOI | SAF/60 | GF/60 | xGF/60 | SAA/60 | GA/60 | xGA/60 | GF% | xGF% | xGF Rel | xGA Rel | xGF% Rel |
|---|---|---|---|---|---|---|---|---|---|---|---|---|---|---|
| 2015-16 | EDM | 55 | 790:59 | 38.00 | 2.43 | 2.00 | 44.07 | 2.88 | 2.53 | 45.71 | 44.13 | -0.22 | 0.32 | -5.97 |
| 2016-17 | EDM | 82 | 1063:38 | 41.41 | 1.92 | 2.21 | 40.95 | 2.26 | 2.52 | 45.95 | 46.76 | -0.18 | 0.22 | -4.27 |
| 2017-18 | EDM | 62 | 840:57 | 43.52 | 2.93 | 2.75 | 43.88 | 2.50 | 2.62 | 53.95 | 51.19 | 0.14 | 0.22 | -0.87 |
| 2018-19 | EDM | 82 | 1145:53 | 36.91 | 2.41 | 2.29 | 44.56 | 2.88 | 2.70 | 45.54 | 45.92 | -0.08 | 0.19 | -2.68 |
| 2019-20 | EDM | 65 | 892:37 | 42.62 | 3.02 | 2.50 | 43.29 | 2.15 | 2.61 | 58.44 | 49.01 | 0.16 | 0.10 | 0.64 |
| 2020-21 | EDM | 52 | 720:45 | 40.62 | 2.33 | 2.99 | 40.12 | 2.50 | 2.42 | 48.28 | 55.27 | 0.80 | -0.01 | 7.88 |
| 2021-22 | EDM | 63 | 804:45 | 38.62 | 2.83 | 2.33 | 45.48 | 2.46 | 2.72 | 53.52 | 46.14 | -0.66 | 0.04 | -6.62 |
| 2022-23 | EDM | 82 | 1079:30 | 42.13 | 3.56 | 2.95 | 41.74 | 2.78 | 2.60 | 56.14 | 53.21 | -0.13 | -0.09 | -0.26 |
| 2023-24 | EDM | 80 | 1072:57 | 50.72 | 3.19 | 3.59 | 37.36 | 2.46 | 2.41 | 56.44 | 59.80 | 0.68 | 0.07 | 4.39 |
| 2024-25 | EDM | 78 | 1010:52 | 43.80 | 2.49 | 2.73 | 37.22 | 2.49 | 2.28 | 50.00 | 54.50 | -0.12 | -0.16 | 0.66 |
| 2025-26 | EDM | 72 | 948:21 | 42.52 | 2.59 | 3.05 | 44.92 | 3.10 | 2.81 | 45.56 | 52.06 | 0.35 | 0.39 | -0.70 |
NHL Edge Stats
| Skating | Shooting | Zone Time | |||||||||||
|---|---|---|---|---|---|---|---|---|---|---|---|---|---|
| Season | GP | Top Speed | Bursts>20/mi | Avg. Speed | Top Speed | Avg. Speed | %Long Range | %Mid Range | %High Danger | ES DZ% | ES NZ% | ES OZ% | |
| This table is for Basic and Premium subscribers only. To view please login to and/or subscribe to one of our subscription plans. | |||||||||||||
Legend
| Percentile 0-25 | Percentile 25-50 | Percentile 50-75 | Percentile 75-100 |
5v5 Lines
| Season | Teammate | Teammate | Team | TOI | GF/60 | GA/60 | GF% | xGF/60 | xGA/60 | xGF% | xGF Rel | xGA Rel | xGF% Rel |
|---|
Glossary
| Type | Statistic | Definition |
|---|---|---|
| Individual | G/60 | Goals Against per 60 minutes. |
| Individual | A/60 | Assists per 60 minutes. |
| Individual | Pts/60 | Points per 60 minutes. |
| Individual | xG/60 | Expected Goals per 60 minutes. |
| Individual | GAE/60 | Goals Above Expected (G/60 - xG/60). |
| Individual | Sh% | Shooting Percentage. |
| Individual | xSh% | Expected Shooting Percentage. |
| Individual | Sh%AE | Shooting percentage above expected (Sh% - xSh%). |
| Individual | %SA Rush | Percentage of shot attempts determined to be on the rush. |
| Individual | %SA Reb. | Percentage of shot attempts determined to be from rebounds. |
| On Ice | SAF/60 | Shot Attempts For per 60 minutes. |
| On Ice | GF/60 | Goals For per 60 minutes. |
| On Ice | xGF/60 | Expected Goals For per 60 minutes. |
| On Ice | SAA/60 | Shot Attempts Against per 60 minutes (lower is better). |
| On Ice | GA/60 | Goals Against per 60 minutes (lower is better). |
| On Ice | xGA/60 | Expected Goals Against per 60 minutes (lower is better). |
| On Ice | GF% | Goals For Percentage = Goals For / (Goals For + Goals Against) |
| On Ice | xGF% | Expected Goals For Percentage = Expected Goals For / (Expected Goals For + Expected Goals Against) |
| On Ice | xGF Rel | xGF/60 when On Ice - xGF/60 when not On Ice. |
| On Ice | xGA Rel | xGA/60 when On Ice - xGA/60 when not On Ice (lower is better). |
| On Ice | xGF% Rel | xGF% when On Ice - xGF% when not On Ice. |
News and Opinions
-
Ryan Nugent-Hopkins scores winner in 1,000th game: Best Oilers moments of 2025-26 at Oilers Nation (Mon Jul 27, 2026)
-
Nugent-Hopkins vs Neal Pionk: Top Edmonton Oilers fights of 2025-26 at Oilers Nation (Mon Jul 20, 2026)
-
Should Mike Babcock cut power-play minutes for the Oilers’ stars? at Oilers Nation (Mon Jul 13, 2026)
-
Oilers 2025-26 Report Cards: Ryan Nugent-Hopkins at The Hockey Writers (Tue Jun 2, 2026)
-
Nugent-Hopkins’ new phase: Oilers 2025-26 player review at Oilers Nation (Mon Jun 1, 2026)
-
Oilers need to build their third line around Nugent-Hopkins at Oilers Nation (Sun May 31, 2026)
-
It’s time for the Oilers to limit Ryan Nugent-Hopkins’ role at Oilers Nation (Mon May 4, 2026)
-
Oilers Need to Consider Moving on From Nurse and Nugent-Hopkins This Offseason at The Hockey Writers (Sat May 2, 2026)
-
Scenes from Morning Skate: Nugent-Hopkins returns to first line as Oilers look to get stars on track in Game 3 at Oilers Nation (Fri Apr 24, 2026)
-
Oilers’ Ryan Nugent-Hopkins nominated for 2026 King Clancy Trophy at Oilers Nation (Fri Apr 10, 2026)
-
Oilers Need Far More From Ryan Nugent-Hopkins at The Hockey Writers (Tue Apr 7, 2026)
-
What should the Oilers’ line combinations look like with Draisaitl and Hyman injured? at Oilers Nation (Mon Apr 6, 2026)
-
Ryan Nugent-Hopkins’ milestone, a nice night for Tristan Jarry, and the Oilers getting value from Jack Roslovic at Oilers Nation (Wed Mar 25, 2026)
-
Oilers’ Ryan Nugent-Hopkins reaches 800 point plateau in NHL career at Oilers Nation (Tue Mar 24, 2026)
-
Oilers Thoughts: Savoie showing he belongs on the top line, Podkolzin rising as a fan favourite, and Nugent-Hopkins to take on a bigger role with Draisaitl out, and more at Oilers Nation (Wed Mar 18, 2026)
-
Ryan Nugent-Hopkins leads by example, Connor Murphy’s first as an Oiler, and a Leon Draisaitl-sized hole at Oilers Nation (Wed Mar 18, 2026)
-
Oilers lineup update: Nugent-Hopkins out for personal reasons, Jones recalled to play vs. Blues at Oilers Nation (Fri Mar 13, 2026)
-
Oilers beat the Avs but lose three players, Tristan Jarry solid in relief, and Ryan Nugent-Hopkins at Oilers Nation (Wed Mar 11, 2026)
-
Ryan Nugent-Hopkins scores game-winner on his big night, Connor Ingram’s shutout, and Zach Hyman at Oilers Nation (Mon Jan 19, 2026)
-
3 Takeaways From the Oilers’ 5-0 Victory Over the Blues at The Hockey Writers (Mon Jan 19, 2026)
-
Nugent-Hopkins scores game-winning goal in 1,000th game as Oilers shutout Blues 5-0: Recap, Reaction and Highlights at Oilers Nation (Mon Jan 19, 2026)
-
Roundtable: What are your favourite memories of Ryan Nugent-Hopkins? at Oilers Nation (Sun Jan 18, 2026)
-
‘RNH is the OG’: Oilers fans share their favourite memories of Ryan Nugent-Hopkins’ first 1,000 games at Oilers Nation (Sun Jan 18, 2026)
-
GDB 50.0: Oilers back home to face the Blues for Ryan Nugent-Hopkins’ 1000th game (6PM MT, SNW) at Oilers Nation (Sun Jan 18, 2026)
-
Nuge Week: Former Oilers teammate Ryan Jones believes Nugent-Hopkins will retire as ‘one of the best’ all-around players to ever play at Oilers Nation (Sun Jan 18, 2026)
-
Nuge Week: A one-on-one with Oilers’ Ryan Nugent-Hopkins discussing his 1,000th Game at Oilers Nation (Sun Jan 18, 2026)
-
Nuge Week: Ryan Nugent-Hopkins’ top 10 most memorable moments ahead of his 1000th game at Oilers Nation (Sun Jan 18, 2026)
-
Welcome to Nuge Week: a celebration of Oilers’ Ryan Nugent-Hopkins ahead of his 1,000th game at Oilers Nation (Thu Jan 15, 2026)
-
Better Lait Than Never: Ryan Nugent-Hopkins’ 500th assist, Oilers trade rumours, and healthy scratches at Oilers Nation (Thu Jan 8, 2026)
-
Oilers’ Ryan Nugent-Hopkins posts 500th assist of NHL career at Oilers Nation (Wed Jan 7, 2026)
-
Team Canada snubs Oilers trio, only McDavid makes the cut at Oil on Whyte (Fri Jan 2, 2026)
-
Oilers’ Calvin Pickard shines, raging Ryan Nugent-Hopkins, and have we seen the last of Andrew Mangiapane at Oilers Nation (Tue Dec 30, 2025)
-
Two Oilers speculated to make Team Canada Olympic roster per Insider at Oil on Whyte (Sun Dec 28, 2025)
-
Oilers Need a Third-Line Centre at The Hockey Writers (Fri Dec 26, 2025)
-
Tristan Jarry hurt already, Ryan Nugent-Hopkins’ Oilers milestones, and Quinn Hutson’s first NHL goal at Oilers Nation (Fri Dec 19, 2025)
-
The impact of Zack Hyman and Ryan Nugent-Hopkins and the Oilers recent play at Oil on Whyte (Sun Dec 14, 2025)
-
Oilers Thoughts: Nugent-Hopkins a special teams ace, Skinner shines amid trade talk, can Frederic build on last game, & more at Oilers Nation (Mon Dec 8, 2025)
-
Connor McDavid’s hat trick, Ryan Nugent-Hopkins quietly solid, and Oilers getting more from Vasily Podkolzin at Oilers Nation (Fri Dec 5, 2025)
-
Oilersnation Radio: The Oilers home stand, Ryan Nugent-Hopkins’ return, and Connor Clattenburg at Oilers Nation (Tue Dec 2, 2025)
-
Edmonton Oilers’ Top-20 Goal Scorers All-Time at The Hockey Writers (Tue Dec 2, 2025)
-
Ryan Nugent-Hopkins’ impactful return, Zach Hyman’s first goal, and Stuart Skinner gets the shutout at Oilers Nation (Sun Nov 30, 2025)
-
Ryan Nugent-Hopkins centres Oilers’ third line alongside Clattenburg as return nears at Oilers Nation (Thu Nov 27, 2025)
-
Nugent-Hopkins Remains Out of Lineup, No Timeline for Return at The Hockey Writers (Wed Nov 19, 2025)
-
Oilers’ Ryan Nugent-Hopkins Placed on Injured Reserve at The Hockey Writers (Mon Nov 10, 2025)
-
Oilers’ Ryan Nugent-Hopkins out a week as Mattias Janmark returns to lineup at Oilers Nation (Mon Nov 10, 2025)
-
Ryan Nugent-Hopkins climbs Oilers all-time games played list, Leon Draisaitl’s heater, and Jack Roslovic scores again at Oilers Nation (Sun Nov 2, 2025)
-
Ryan Nugent-Hopkins providing much-needed consistency in Oilers’ top-six at Oilers Nation (Sat Nov 1, 2025)
-
Oilers News & Rumours: Sorokin, Nugent-Hopkins, Hyman at The Hockey Writers (Tue Oct 28, 2025)
-
Oilers’ Ryan Nugent-Hopkins Is on Fire to Start the Season at The Hockey Writers (Sun Oct 26, 2025)
-
Oilers special teams a mess, the snake bite is real, but at least Ryan Nugent-Hopkins stays hot at Oilers Nation (Sat Oct 18, 2025)
-
Rough night for Evan Bouchard, Oilers giveaways everywhere, and a hat tip to Ryan Nugent-Hopkins at Oilers Nation (Fri Oct 17, 2025)
-
What does a successful 2025-26 season look like for Oilers’ Ryan Nugent-Hopkins? at Oilers Nation (Sat Sep 20, 2025)
-
Real Life Podcast: Ryan Nugent-Hopkins’ 15th season, Blue Jays playoff chase, and the NFL season at Oilers Nation (Thu Sep 4, 2025)
-
Oilers Milestone Watch: Ryan Nugent-Hopkins closing in on team record for games played at Oilers Nation (Sat Aug 30, 2025)
-
Should the Oilers Ryan Nugent-Hopkins play at centre or on the wing? at Oilers Nation (Sun Aug 24, 2025)
-
Ryan Nugent-Hopkins Poised to Break Major Oilers Records at Oil on Whyte (Fri Aug 22, 2025)
-
How Oilers' Ryan Nugent-Hopkins Went From Newbie To Grizzled Veteran at The Hockey News (Mon Aug 18, 2025)
-
From Renney to Knoblauch: The nine head coaches of Ryan Nugent-Hopkins’ career with the Oilers at Oilers Nation (Sun Aug 10, 2025)
-
Oilers: How Ryan Nugent-Hopkins stacks up with the 2011 NHL Draft at Oilers Nation (Tue Aug 5, 2025)
-
Ryan Nugent-Hopkins continues to be a jack-of-all-trades: 2024-25 Edmonton Oilers player review at Oilers Nation (Sat Aug 2, 2025)
-
Oilers 2024-25 Report Cards: Ryan Nugent-Hopkins at The Hockey Writers (Sat Jul 26, 2025)
-
Oilers’ Nugent-Hopkins and the Value of Loyalty & Staying the Course at The Hockey Writers (Sat Jul 26, 2025)
-
Ryan Nugent-Hopkins Delivered Against Stars, Can He Do It Again Against Panthers? at Oil on Whyte (Fri May 30, 2025)
Current Contract
Ryan Nugent-Hopkins signed an $41,000,000 8-year contract with the Edmonton Oilers and General Manager Ken Holland on June 29, 2021 with an AAV of $5,125,000. This contract will start in 2021-22 and end after the 2028-29 season. In the first season of the contract the cap hit was equivalent to 6.29% of the salary cap.
Standard Contract (UFA) ( ) (0 ratings)
Ryan Nugent-Hopkins signed a $42,000,000 7-year contract with the Edmonton Oilers and General Manager Craig MacTavish on September 19, 2013 with an AAV of $6,000,000. This contract will start in 2014-15 and end after the 2020-21 season. In the first season of the contract the cap hit was equivalent to 8.70% of the salary cap.
Standard Contract (RFA) ( ) (0 ratings)
| Season | Age* | Clause | Cap Hit | AAV | Perf. Bonus | Sign. Bonus | Salary | Compensation | Minors Salary | Status | |
|---|---|---|---|---|---|---|---|---|---|---|---|
| 2014-15 | 21 | $6,000,000 | $6,000,000 | - | - | $6,000,000 | $6,000,000 | $6,000,000 | RFA | ||
| 2015-16 | 22 | $6,000,000 | $6,000,000 | - | - | $6,000,000 | $6,000,000 | $6,000,000 | RFA-arb | ||
| 2016-17 | 23 | $6,000,000 | $6,000,000 | - | - | $6,000,000 | $6,000,000 | $6,000,000 | RFA-arb | ||
| 2017-18 | 24 | $6,000,000 | $6,000,000 | - | - | $6,000,000 | $6,000,000 | $6,000,000 | RFA-arb | ||
| 2018-19 | 25 | $6,000,000 | $6,000,000 | - | - | $6,000,000 | $6,000,000 | $6,000,000 | UFA | ||
| 2019-20 | 26 | $6,000,000 | $6,000,000 | - | - | $6,000,000 | $6,000,000 | $6,000,000 | UFA | ||
| 2020-21 | 27 | $6,000,000 | $6,000,000 | - | - | $6,000,000 | $6,000,000 | $6,000,000 | UFA | ||
| Total | - | - | $42,000,000 | $42,000,000 | $42,000,000 |
Ryan Nugent-Hopkins signed a $2,775,000 3-year contract with the Edmonton Oilers and General Manager Steve Tambellini on July 2, 2011 with an AAV of $925,000. This contract will start in 2011-12 and end after the 2013-14 season. In the first season of the contract the cap hit was equivalent to 1.44% of the salary cap.
Entry Level Contract ( ) (0 ratings)
| Season | Age* | Clause | Cap Hit | AAV | Perf. Bonus | Sign. Bonus | Salary | Compensation | Minors Salary | Status | |
|---|---|---|---|---|---|---|---|---|---|---|---|
| 2011-12 | 18 | $925,000 | $3,775,000 | $2,850,000 | $92,500 | $832,500 | $925,000 | $70,000 | ELC | ||
| 2012-13 | 19 | $925,000 | $3,775,000 | $2,850,000 | $92,500 | $832,500 | $925,000 | $70,000 | ELC | ||
| 2013-14 | 20 | $925,000 | $3,775,000 | $2,850,000 | $92,500 | $832,500 | $925,000 | $70,000 | ELC | ||
| Total | $8,550,000 | $277,500 | $2,497,500 | $2,775,000 | $210,000 |
Career Statistics
| Regular Season | Playoffs | |||||||||||||||||||
|---|---|---|---|---|---|---|---|---|---|---|---|---|---|---|---|---|---|---|---|---|
| Season | League | Team | GP | G | A | Pts | +/- | PIM | Shots | Sh% | TOI/G | GP | G | A | Pts | +/- | PIM | Shots | Sh% | TOI/G |
| 2006-07 | Minor-BC | Burnaby W.C. | 65 | 43 | 43 | 86 | 34 | |||||||||||||
| 2007-08 | Minor-BC | Burnaby W.C. | 66 | 119 | 95 | 214 | 84 | |||||||||||||
| 2008-09 | WHL | Red Deer | 5 | 2 | 4 | 6 | -6 | |||||||||||||
| 2008-09 | BCMML | Van. NW Giants | 36 | 40 | 47 | 87 | 78 | 5 | 5 | 5 | 10 | 4 | ||||||||
| 2009-10 | WHL | Red Deer | 67 | 24 | 41 | 65 | -4 | 28 | 4 | 2 | 2 | -2 | ||||||||
| 2010-11 | WHL | Red Deer | 69 | 31 | 75 | 106 | +30 | 51 | 9 | 4 | 7 | 11 | -3 | 6 | ||||||
| 2011-12 | NHL | Edmonton Oilers | 62 | 18 | 34 | 52 | -2 | 16 | 134 | 13.4 | 17:36 | |||||||||
| 2011-12 | WC-A | Canada | 8 | 4 | 2 | 6 | +2 | 4 | ||||||||||||
| 2012-13 | NHL | Edmonton Oilers | 40 | 4 | 20 | 24 | +3 | 8 | 78 | 5.1 | 18:52 | |||||||||
| 2012-13 | AHL | Oklahoma City | 19 | 8 | 12 | 20 | +7 | 6 | 50 | 1,600.0 | ||||||||||
| 2012-13 | WJC-A | Canada | 6 | 4 | 11 | 15 | +6 | 4 | ||||||||||||
| 2013-14 | NHL | Edmonton Oilers | 80 | 19 | 37 | 56 | -12 | 26 | 178 | 10.7 | 20:24 | |||||||||
| 2014-15 | NHL | Edmonton Oilers | 76 | 24 | 32 | 56 | -12 | 25 | 189 | 12.7 | 20:38 | |||||||||
| 2015-16 | NHL | Edmonton Oilers | 55 | 12 | 22 | 34 | -9 | 18 | 108 | 11.1 | 19:04 | |||||||||
| 2016-17 | WCup | Team North America | 3 | 1 | 2 | 3 | +1 | 2 | ||||||||||||
| 2016-17 | NHL | Edmonton Oilers | 82 | 18 | 25 | 43 | -10 | 29 | 200 | 9.0 | 17:42 | 13 | 4 | 4 | -3 | 2 | 33 | 0.0 | 18:25 | |
| 2017-18 | NHL | Edmonton Oilers | 62 | 24 | 24 | 48 | +10 | 20 | 151 | 15.9 | 18:05 | |||||||||
| 2017-18 | WC | Canada | 10 | 5 | 3 | 8 | +5 | 2 | ||||||||||||
| 2018-19 | NHL | Edmonton Oilers | 82 | 28 | 41 | 69 | -13 | 26 | 208 | 13.5 | 20:06 | |||||||||
| 2019-20 | NHL | Edmonton Oilers | 65 | 22 | 39 | 61 | +1 | 33 | 172 | 12.8 | 20:28 | 4 | 2 | 6 | 8 | -2 | 22 | 9.1 | 22:26 | |
| 2020-21 | NHL | Edmonton Oilers | 52 | 16 | 19 | 35 | -4 | 22 | 135 | 11.9 | 20:46 | 4 | 1 | 1 | 2 | -2 | 14 | 7.1 | 24:24 | |
| 2021-22 | NHL | Edmonton Oilers | 63 | 11 | 39 | 50 | +3 | 16 | 154 | 7.1 | 19:19 | 16 | 6 | 8 | 14 | -3 | 14 | 35 | 17.1 | 20:22 |
| 2022-23 | NHL | Edmonton Oilers | 82 | 37 | 67 | 104 | +12 | 35 | 201 | 18.4 | 19:48 | 12 | 1 | 10 | 11 | -6 | 4 | 23 | 4.3 | 20:08 |
| 2023-24 | NHL | Edmonton Oilers | 80 | 18 | 49 | 67 | +10 | 36 | 183 | 9.8 | 19:37 | 25 | 7 | 15 | 22 | -2 | 8 | 37 | 18.9 | 20:19 |
| 2024-25 | NHL | Edmonton Oilers | 78 | 20 | 29 | 49 | +4 | 24 | 164 | 12.2 | 18:58 | 22 | 6 | 14 | 20 | +4 | 6 | 48 | 12.5 | 19:35 |
| 2025-26 | NHL | Edmonton Oilers | 72 | 20 | 36 | 56 | -9 | 21 | 133 | 15.0 | 19:04 | 6 | 2 | 3 | 5 | -1 | 2 | 7 | 28.6 | 17:46 |
| NHL Career | 1031 | 291 | 513 | 804 | -28 | 355 | 2388 | 12.2 | 19:23 | 102 | 25 | 61 | 86 | -15 | 36 | 219 | 11.4 | 20:00 | ||