
 Owen Tippett
| Position | Right Wing / Left Wing | Current Team | Philadelphia Flyers |
| Shoots | Right | Current Contract | 8 years ($6.2M CapHit) |
| Height | 6'1" | Expires | 2031-32 |
| Weight (lbs) | 210 | Expiry Age (Jun 30) | 33 |
| Age (DOB) | 27 (Feb 16, 1999) | Expiry Status | UFA |
| Drafted | 2017, Round 1, Overall 10 (FLA) |
| Date | Team | Transaction | |
|---|---|---|---|
| Jan 26, 2024 | Philadelphia Flyers | Signed 8 years @ $6.200M AAV starting in 2024-25 | |
| Jul 29, 2022 | Philadelphia Flyers | Signed 2 years @ $1.500M AAV starting in 2022-23 | |
| Jul 19, 2017 | Florida Panthers | Signed to an entry level contract. |
Player Card(s)
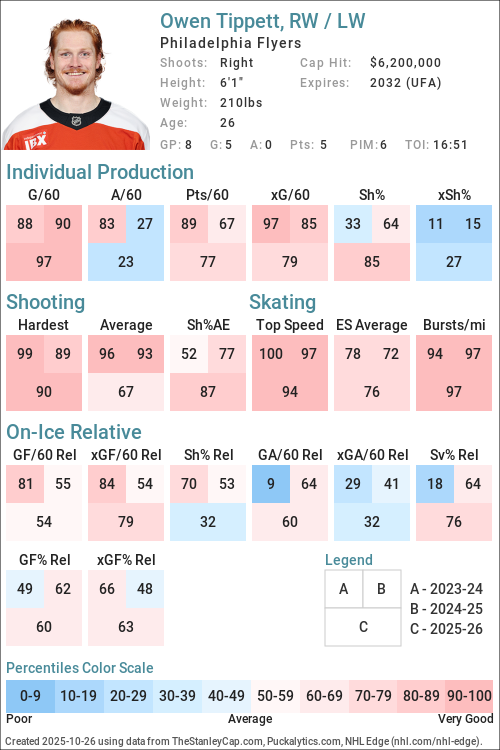
URL: https://thestanleycap.com/cdn/player_cards/20252026/owen-tippett-8480015.png
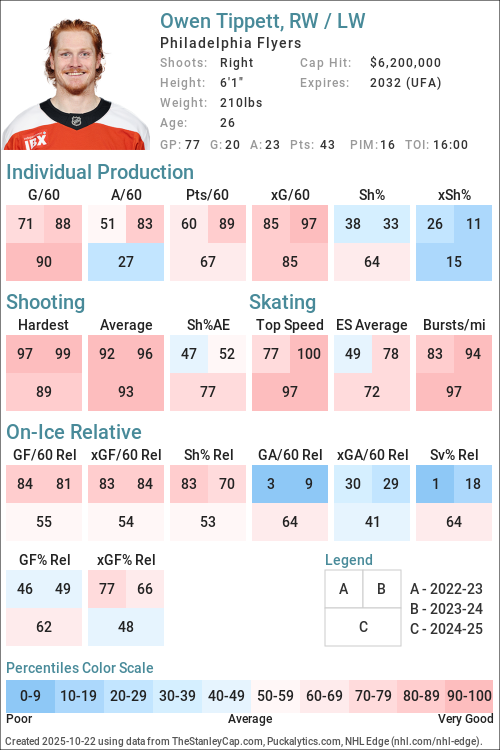
URL: https://thestanleycap.com/cdn/player_cards/20242025/owen-tippett-8480015.png
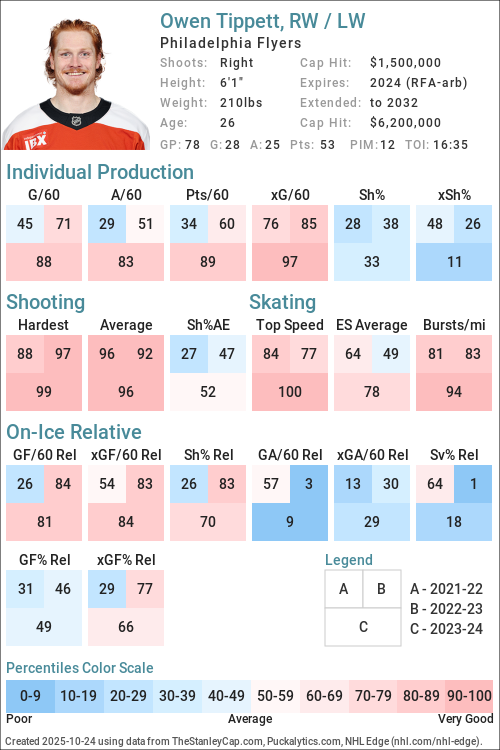
URL: https://thestanleycap.com/cdn/player_cards/20232024/owen-tippett-8480015.png
About Player Cards
Player cards present an infographic of a players performance using a series of Player Archetypes developed for Puckalytics.com and TheStanleyCap.com. The boxes in the rink image show the archetype ratings for the season specified in the card while the graphs to the right show the five-year trends for those archetypes.
Except for Faceoffs, the values shown are the players z-score (standard deviation from the mean) for the specific metric used to calculate the archetype values. When calculating z-scores forwards were compared to forwards and defensemen were compared to defensemen. Positive values indicate the player is above average and shaded in blue, while negative values indicate the player is below average and shaded in pink. The five year trend charts show a range of -4.0 to 4.0.
The value shown for Faceoffs is the faceoff winning percentage rather than their z-score with winning percentages below 50 in pink shades and above 50 in blue shades.
All archetypes are 5v5 except 5v4 TOI, 4v5 TOI, Skating (even strength) and Faceoffs (all situations). Archetypes use regular season data only.
Archetypes Summary
- Sniper - Measures the to score above the expected goal rate.
- Rebound - Measures the percent of a players shot attempts that come from rebounds (forwards only).
- 5v4 TOI - Powerplay ice time, calculated as the percentage of his teams 5v4 ice time that the player was on the ice for.
- Shooter - Measures whether a players points come from shots (goals or assists on rebounds from his shots).
- Producer - Measures a players ability to produce goals and assists, adjusted for quality of teammates.
- Playmaker - Measures whether a players points come from passes.
- Drive - Measures a players ability to drive puck possession and generate shot attempts for his team.
- Rush - Measures the percent of a players shot attempts that come from rush plays
- Possession - An indicator of a players ability to improve his teams puck possession game.
- Faceoffs - Faceoff Winning Percentage (min. 75 faceoffs taken).
- 5v5 TOI - The percentage of his teams 5v5 TOI that the player was on the ice for.
- Suppress - Measures a players ability to suppress opponent puck possession and shot attempts against.
- Skating - An indicator of a players skating ability, or speed bursts above 20mph per mile skated.
- Defend - An indicator of a players ability to suppress shot quality against.
- 4v5 TOI - Penalty Kill ice time, calculated as the percentage of his teams 4v5 ice time that the player was on the ice for.
Data Sources
- Salary data is from TheStanleyCap.com
- Skating data is from NHL Edge
- Other statistics are from Puckalytics.com and derived from data from NHL.com
Terms of Use
You are free to use include player cards in written articles, share on social media, or on other public websites under the following conditions:
- You credit TheStanleyCap.com as the source and provide a link back to TheStanleyCap.com or this player page.
- You do not mass copy/duplicate/publish dozens or hundreds of player cards. A few, or a handful for a written article is fine. Be reasonable. Fair use rules apply.
- If you are a high-traffic website you must download and host the image(s) on your site rather than overload TheStanleyCap servers with traffic.
Note: Player cards will update daily throughout the season so if you want to include snapshot then you must download the image.
If you have any questions, send an e-mail to the e-mail address at the top of this page.
Read Introducing Player Archetypes on HockeyAnalysis.com for more details on archetype calculations.
Core Archetypes
| Season | Team(s) | GP | TOI | Producer | Playmaker | Shooter | Sniper | Rebound | Rush | Skating | Defend |
|---|---|---|---|---|---|---|---|---|---|---|---|
| 2017-18 | FLA | 7 | -0.27 | -1.68 | 4.87 | 0.90 | 3.79 | 1.36 | - | -1.54 | |
| 2020-21 | FLA | 45 | 1.16 | 0.44 | 0.33 | -1.02 | 0.15 | -0.76 | - | -0.28 | |
| 2021-22 | FLA, PHI | 63 | -0.75 | -0.74 | -0.44 | -0.67 | -0.08 | 1.74 | 0.80 | 0.29 | |
| 2022-23 | PHI | 77 | -0.02 | -0.36 | 0.19 | 0.02 | -0.26 | 0.68 | 0.89 | -2.14 | |
| 2023-24 | PHI | 78 | 1.41 | 0.66 | 1.07 | 0.23 | -0.84 | 2.37 | 1.97 | -0.89 | |
| 2024-25 | PHI | 77 | 0.28 | -0.92 | 1.69 | 0.74 | -2.31 | 1.50 | 2.41 | 0.41 | |
| 2025-26 | PHI | 81 | 1.40 | 0.31 | 1.51 | 0.43 | -1.15 | 1.73 | 3.24 | -1.25 |
Situational and Secondary Archetypes
| Season | Team(s) | GP | TOI | 5v5 TOI | 5v4 TOI | 4v5 TOI | Possession | Drive | Suppress | Faceoffs |
|---|---|---|---|---|---|---|---|---|---|---|
| 2017-18 | FLA | 7 | -1.29 | -0.47 | -1.95 | -1.26 | 0.41 | -3.48 | - | |
| 2020-21 | FLA | 45 | -0.90 | -1.38 | -2.19 | -0.32 | 0.42 | -1.13 | - | |
| 2021-22 | FLA, PHI | 63 | -0.41 | -0.37 | -2.02 | 0.18 | 0.00 | 0.31 | - | |
| 2022-23 | PHI | 77 | 0.89 | 0.47 | -1.31 | 0.33 | 0.63 | -0.41 | - | |
| 2023-24 | PHI | 78 | 0.47 | 0.45 | -1.99 | 0.30 | 0.93 | -0.80 | - | |
| 2024-25 | PHI | 77 | 0.26 | -0.00 | -2.05 | 0.64 | 0.75 | -0.06 | - | |
| 2025-26 | PHI | 81 | 0.48 | 0.17 | -1.38 | 0.80 | 0.91 | -0.11 | - |
5v5 Individual Stats
| Season | Team(s) | GP | TOI | G/60 | A/60 | Pts/60 | xG/60 | GAE/60 | Sh% | xSh% | Sh%AE | %SA Rush | %SA Reb. |
|---|---|---|---|---|---|---|---|---|---|---|---|---|---|
| 2017-18 | FLA | 7 | 62:50 | 0.95 | 0.00 | 0.95 | 0.61 | 0.35 | 8.33 | 5.30 | 3.03 | 6.67 | 13.33 |
| 2020-21 | FLA | 45 | 464:24 | 0.52 | 1.29 | 1.81 | 0.91 | -0.39 | 5.63 | 9.87 | -4.24 | 2.11 | 6.32 |
| 2021-22 | FLA | 42 | 459:58 | 0.65 | 0.91 | 1.57 | 0.82 | -0.17 | 7.81 | 9.82 | -2.01 | 7.41 | 7.41 |
| 2021-22 | PHI | 21 | 260:50 | 0.69 | 0.46 | 1.15 | 0.97 | -0.28 | 7.89 | 11.15 | -3.26 | 7.55 | 3.77 |
| 2021-22 | FLA, PHI | 63 | 720:48 | 0.67 | 0.75 | 1.42 | 0.88 | -0.21 | 7.84 | 10.32 | -2.47 | 7.46 | 5.97 |
| 2022-23 | PHI | 77 | 1067:37 | 0.84 | 0.96 | 1.80 | 0.89 | -0.04 | 8.98 | 9.45 | -0.47 | 5.13 | 6.41 |
| 2023-24 | PHI | 78 | 1002:48 | 1.08 | 1.26 | 2.33 | 0.96 | 0.12 | 8.61 | 7.69 | 0.92 | 8.84 | 5.44 |
| 2024-25 | PHI | 77 | 997:17 | 1.08 | 0.66 | 1.74 | 0.84 | 0.24 | 12.00 | 9.35 | 2.65 | 4.72 | 0.86 |
| 2025-26 | PHI | 81 | 1053:08 | 1.08 | 1.03 | 2.11 | 0.99 | 0.09 | 12.42 | 11.33 | 1.09 | 5.33 | 4.44 |
5v5 On Ice Stats
| Season | Team(s) | GP | TOI | SAF/60 | GF/60 | xGF/60 | SAA/60 | GA/60 | xGA/60 | GF% | xGF% | xGF Rel | xGA Rel | xGF% Rel |
|---|---|---|---|---|---|---|---|---|---|---|---|---|---|---|
| 2017-18 | FLA | 7 | 62:50 | 42.02 | 0.95 | 1.87 | 54.43 | 5.73 | 3.32 | 14.29 | 36.11 | -0.43 | 0.85 | -12.13 |
| 2020-21 | FLA | 45 | 464:24 | 45.99 | 1.94 | 2.79 | 40.57 | 2.58 | 2.29 | 42.86 | 54.88 | -0.03 | 0.11 | -1.51 |
| 2021-22 | FLA | 42 | 459:58 | 47.87 | 2.74 | 2.90 | 39.00 | 2.35 | 2.87 | 53.85 | 50.26 | -0.43 | 0.44 | -7.57 |
| 2021-22 | PHI | 21 | 260:50 | 42.33 | 2.53 | 2.99 | 42.56 | 3.22 | 2.84 | 44.00 | 51.27 | 0.72 | 0.09 | 6.04 |
| 2021-22 | FLA, PHI | 63 | 720:48 | 45.87 | 2.66 | 2.93 | 40.29 | 2.66 | 2.86 | 50.00 | 50.63 | -0.04 | 0.32 | -3.37 |
| 2022-23 | PHI | 77 | 1067:37 | 42.94 | 2.87 | 2.77 | 43.11 | 3.37 | 2.82 | 45.95 | 49.49 | 0.47 | 0.21 | 2.73 |
| 2023-24 | PHI | 78 | 1002:48 | 49.00 | 3.11 | 2.69 | 40.45 | 3.23 | 2.44 | 49.06 | 52.42 | 0.24 | 0.26 | -0.57 |
| 2024-25 | PHI | 77 | 997:17 | 42.05 | 2.59 | 2.51 | 38.56 | 2.71 | 2.05 | 48.86 | 55.07 | 0.09 | -0.12 | 2.32 |
| 2025-26 | PHI | 81 | 1053:08 | 39.08 | 2.56 | 2.71 | 37.89 | 2.73 | 2.24 | 48.39 | 54.82 | 0.41 | -0.08 | 4.88 |
NHL Edge Stats
| Skating | Shooting | Zone Time | |||||||||||
|---|---|---|---|---|---|---|---|---|---|---|---|---|---|
| Season | GP | Top Speed | Bursts>20/mi | Avg. Speed | Top Speed | Avg. Speed | %Long Range | %Mid Range | %High Danger | ES DZ% | ES NZ% | ES OZ% | |
| This table is for Basic and Premium subscribers only. To view please login to and/or subscribe to one of our subscription plans. | |||||||||||||
Legend
| Percentile 0-25 | Percentile 25-50 | Percentile 50-75 | Percentile 75-100 |
5v5 Lines
| Season | Teammate | Teammate | Team | TOI | GF/60 | GA/60 | GF% | xGF/60 | xGA/60 | xGF% | xGF Rel | xGA Rel | xGF% Rel |
|---|
Glossary
| Type | Statistic | Definition |
|---|---|---|
| Individual | G/60 | Goals Against per 60 minutes. |
| Individual | A/60 | Assists per 60 minutes. |
| Individual | Pts/60 | Points per 60 minutes. |
| Individual | xG/60 | Expected Goals per 60 minutes. |
| Individual | GAE/60 | Goals Above Expected (G/60 - xG/60). |
| Individual | Sh% | Shooting Percentage. |
| Individual | xSh% | Expected Shooting Percentage. |
| Individual | Sh%AE | Shooting percentage above expected (Sh% - xSh%). |
| Individual | %SA Rush | Percentage of shot attempts determined to be on the rush. |
| Individual | %SA Reb. | Percentage of shot attempts determined to be from rebounds. |
| On Ice | SAF/60 | Shot Attempts For per 60 minutes. |
| On Ice | GF/60 | Goals For per 60 minutes. |
| On Ice | xGF/60 | Expected Goals For per 60 minutes. |
| On Ice | SAA/60 | Shot Attempts Against per 60 minutes (lower is better). |
| On Ice | GA/60 | Goals Against per 60 minutes (lower is better). |
| On Ice | xGA/60 | Expected Goals Against per 60 minutes (lower is better). |
| On Ice | GF% | Goals For Percentage = Goals For / (Goals For + Goals Against) |
| On Ice | xGF% | Expected Goals For Percentage = Expected Goals For / (Expected Goals For + Expected Goals Against) |
| On Ice | xGF Rel | xGF/60 when On Ice - xGF/60 when not On Ice. |
| On Ice | xGA Rel | xGA/60 when On Ice - xGA/60 when not On Ice (lower is better). |
| On Ice | xGF% Rel | xGF% when On Ice - xGF% when not On Ice. |
News and Opinions
-
Oilers Should Target Owen Tippett if Flyers Land Leo Carlsson at The Hockey Writers (Thu Jul 9, 2026)
-
What Leo Carlsson’s contract would mean for the Flyers’ salary cap at Broad Street Hockey (Fri Jul 3, 2026)
-
Flyers Star Winger Makes NHL Insider's New Trade Board at Yahoo Sports NHL (Fri Jun 26, 2026)
-
Could Sunny Mehta and/or Sheldon Keefe Look To Their Past to Address the Devils’ Future? at All About the Jersey (Wed Jun 24, 2026)
-
Could Sunny Mehta and/or Sheldon Keefe Look To Their Past to Address the Devils’ Future? at Yahoo Sports NHL (Wed Jun 24, 2026)
-
Owen Tippett might be floated as trade target as Flyers open to shake-up at Broad Street Buzz (Tue Jun 23, 2026)
-
5 moves the Flyers could make on their infamous June 23 at Broad Street Hockey (Mon Jun 22, 2026)
-
NHL Rumors: Tippett, Zegras, Tuch, Mantha, McMann, Arvidsson, Tarasenko, Roslovic, Bobrovsky, Kane, Shea, and Greer at NHL Rumors (Sat Jun 20, 2026)
-
Latest Wild trade target sounds more like a pipe dream than a solution at Gone Puck Wild (Thu Jun 18, 2026)
-
Where Are They Now? Every Panthers First-Round Pick From the Last Decade at The Rat Trick (Wed Jun 17, 2026)
-
Report: Flyers drawing trade interest from 3 teams for Owen Tippett at Broad Street Hockey (Tue Jun 16, 2026)
-
Before the Flyers trade Owen Tippett, somebody should explain why they'd want to at Broad Street Buzz (Sat Jun 13, 2026)
-
2025-26 Player Grades: Owen Tippett takes a major step forward at Broad Street Hockey (Wed Jun 10, 2026)
-
Owen Tippett trade rumors gaining traction for unsurprising reason at Pens Labyrinth (Sat Jun 6, 2026)
-
Owen Tippett should not be involved in trade talks this summer at Broad Street Buzz (Fri Jun 5, 2026)
-
Owen Tippett should be given some patience, as he might not feel like himself until December or January at Flyers Nitty Gritty (Fri Jun 5, 2026)
-
Oilers can keep dreaming about Owen Tippett trade at Broad Street Buzz (Wed Jun 3, 2026)
-
The Flyers shouldn’t trade Owen Tippett unless they get a massive return at Broad Street Hockey (Wed Jun 3, 2026)
-
Oilers reportedly interested in Flyers’ Owen Tippett in latest trade rumor at Broad Street Hockey (Tue Jun 2, 2026)
-
Why Flyers winger Owen Tippett is on the Oilers’ radar at Oilers Nation (Tue Jun 2, 2026)
-
Philadelphia Flyers Best Games of 2025-26: Forwards at Flyer Nation (Wed May 20, 2026)
-
2025-2026 Philadelphia Flyers Exit Interviews at Flyer Nation (Thu May 14, 2026)
-
Owen Tippett reveals concerning reason why he missed second round of playoffs at Broad Street Buzz (Tue May 12, 2026)
-
Flyers, Owen Tippett Share Gruesome Injury Update; Surgery Not Needed Yet at Yahoo Sports NHL (Tue May 12, 2026)
-
NHL Rumors: Oilers Chasing Cassidy, Tippett Statement, Coyle Signs at The Hockey Writers (Tue May 12, 2026)
-
Owen Tippett missed entire second-round playoff series for Philadelphia Flyers due to internal bleeding at Russian Machine Never Breaks (Tue May 12, 2026)
-
Flyers’ Owen Tippett suffered internal bleeding issue in First Round against Penguins at Flyer Nation (Tue May 12, 2026)
-
Owen Tippett dealt with internal bleeding during the 2026 NHL Playoffs at Flyers Nitty Gritty (Tue May 12, 2026)
-
Flyers’ Owen Tippett reveals he was dealing with internal bleeding at Broad Street Hockey (Tue May 12, 2026)
-
Flyers, Owen Tippett Reveal Injury That Kept Him Out of Round 2 at Philly Hockey Now (Tue May 12, 2026)
-
Tippett missed second round of playoffs because of internal bleeding at Yahoo Sports NHL (Tue May 12, 2026)
-
Both Matvei Michkov and Owen Tippett finished with identical numbers in the Regular Season at Flyers Nitty Gritty (Mon May 11, 2026)
-
Owen Tippett Injury Update; Flyers Weighing More Lineup Changes at Yahoo Sports NHL (Sat May 9, 2026)
-
Flyers won't have Tippett in do-or-die Game 4 against Hurricanes at Yahoo Sports NHL (Sat May 9, 2026)
-
3 Flyers Who Have Most to Prove vs. Hurricanes in Crunch Time at Yahoo Sports NHL (Thu May 7, 2026)
-
Owen Tippett In or Out? Flyers Face Important Lineup Decisions at Yahoo Sports NHL (Thu May 7, 2026)
-
Owen Tippett is out again for Game 3 at Flyers Nitty Gritty (Thu May 7, 2026)
-
Flyers-Hurricanes Game 3: Lines, Notes, & How to Watch at Philly Hockey Now (Thu May 7, 2026)
-
The path forward for Flyers after brutal 0-2 start against the Hurricanes at Broad Street Buzz (Tue May 5, 2026)
-
Tippett, Nikishin both out again for Game 2 of Flyers-Hurricanes 2nd-round series in NHL playoffs at Yahoo Sports NHL (Mon May 4, 2026)
-
Flyers winger Owen Tippett out for Game 2 against Carolina at Broad Street Hockey (Mon May 4, 2026)
-
Dan Vladar will start tonight for the Flyers, Owen Tippett remains questionable at Flyers Nitty Gritty (Mon May 4, 2026)
-
Flyers Analysis: Tired Legs, In-Game Line Changes, & the Impact of No Tippett at Philly Hockey Now (Sun May 3, 2026)
-
Flyers' Tippett, Hurricanes' Nikishin out for opener of 2nd-round series at Yahoo Sports NHL (Sat May 2, 2026)
-
Owen Tippett questionable for Game 1 in potential blow for Flyers at Broad Street Hockey (Sat May 2, 2026)
-
Is Flyers Forward Owen Tippett Questionable for Game 1? at Philly Hockey Now (Sat May 2, 2026)
-
Grading every Flyer in the series win over the Penguins at Broad Street Hockey (Thu Apr 30, 2026)
-
Owen Tippett trolls Sidney Crosby with ‘Crosby sucks’ message on signed puck at Broad Street Hockey (Fri Apr 24, 2026)
-
Flyers, Veterans Put Penguins in 3-0 Chokehold with Savvy Performance at Yahoo Sports NHL (Thu Apr 23, 2026)
-
Flyers' Owen Tippett Has Permanently Silenced NHL Trade Rumors at Yahoo Sports NHL (Tue Apr 21, 2026)
-
Recap; 2026 ECQF Game 2: Vladař earns shutout as Flyers take 2-0 series lead over Penguins at Flyer Nation (Tue Apr 21, 2026)
-
Owen Tippett dunked on the Penguins and stood over their lifeless body at Broad Street Hockey (Tue Apr 21, 2026)
-
Travis Konecny praises Owen Tippett, and it’s a reminder of just how impactful he can be at Flyers Nitty Gritty (Tue Apr 21, 2026)
-
Flyers Postgame Blog: Philly is For Real at Philly Hockey Now (Tue Apr 21, 2026)
-
Flyers Shutout Pens in Game 2 – Haste Makes Waste at Flyers Nitty Gritty (Tue Apr 21, 2026)
-
Takeaways: Flyers execute, survive to take commanding 2-0 series lead at Broad Street Hockey (Mon Apr 20, 2026)
-
Comparing this year’s Flyers lineup to the last time they were in the playoffs at Broad Street Hockey (Thu Apr 16, 2026)
-
Predicting the Flyers end of season awards at Broad Street Buzz (Sat Apr 11, 2026)
-
Flyers vs. Red Wings: How to watch, lineups, and gamethread at Broad Street Hockey (Thu Apr 2, 2026)
-
Flyers get unexpected boost as Tyson Foerster returns to lineup at Broad Street Hockey (Thu Apr 2, 2026)
-
Cates, Tippett Leading Charge Offensively for Streaking Flyers at Flyer Nation (Tue Mar 31, 2026)
-
Zegras Wins it in Overtime, Flyers Beat Stars 2-1 at Philly Hockey Now (Sun Mar 29, 2026)
-
Recap; Game 72/82: Tippett’s hat trick powers Flyers to 5-3 win over Red Wings at Flyer Nation (Sun Mar 29, 2026)
-
3 ideal Flyers linemates for Porter Martone’s NHL debut at Broad Street Hockey (Sun Mar 29, 2026)
-
Game Breakdown: Tippett’s four-point night helps keep Flyers playoff hopes alive at Flyers Nitty Gritty (Sun Mar 29, 2026)
-
Flyers Red Wings Series Could Make or Break The Season at Flyers Nitty Gritty (Sun Mar 29, 2026)
-
Flyers Postgame Blog: Tippett Shines; Two Power-Play Goals; Impact on the Playoff Push at Philly Hockey Now (Sun Mar 29, 2026)
-
Takeaways: Owen Tippett scores a hat trick in Flyers’ 5-3 win over Red Wings at Broad Street Hockey (Sun Mar 29, 2026)
-
Owen Tippett’s hat trick powers the Flyers to a 5-3 win over the Red Wings at Yahoo Sports NHL (Sun Mar 29, 2026)
-
Red Wings-Flyers Tweetcap: could’ve, would’ve, should’ve at The Malik Report (Sun Mar 29, 2026)
-
Flyers Fight Off Late Scare From Red Wings, Tippett’s Hat Trick Leads the Way in 5-3 Win at Philly Hockey Now (Sun Mar 29, 2026)
-
Owen Tippett is on a heater for the Flyers at Flyers Nitty Gritty (Sat Mar 28, 2026)
-
Owen Tippett should have a long-term spot with the Flyers at Pens Labyrinth (Fri Mar 27, 2026)
-
Flyers’ Owen Tippett becoming do-it-all force — even at center at Broad Street Hockey (Mon Mar 23, 2026)
-
Owen Tippett is proving the critics wrong and showing his value at Pens Labyrinth (Sun Mar 22, 2026)
-
Flyers Postgame Blog: Power Play Shows Improvement; Tippett Stays Scorching; A Game Changing Moment at Philly Hockey Now (Sat Mar 21, 2026)
-
Flyers Sweep California Road Trip, Earn a Big Win vs. Sharks on Saturday at Philly Hockey Now (Sat Mar 21, 2026)
-
Takeaways: Flyers bite San Jose 4-1, sweeping West Coast trek and staying alive at Broad Street Hockey (Sat Mar 21, 2026)
-
Flyers’ Owen Tippett is becoming untradeable at Broad Street Hockey (Thu Mar 19, 2026)
-
Recap; Game 67/82: Glendening gets it started, Cates ends it in Flyers’ OT win at Flyer Nation (Thu Mar 19, 2026)
-
Takeaways: Flyers a cut above Anaheim in 3-2 overtime victory on West Coast opener at Broad Street Hockey (Thu Mar 19, 2026)
-
Cates’ Overtime Heroics Pushes Flyers Past Ducks 3-2 on Wednesday at Philly Hockey Now (Thu Mar 19, 2026)
-
Flyers Rumors: Forward’s name not going away in trade talk at Broad Street Buzz (Tue Mar 17, 2026)
-
Blind Stats Test: Matvei Michkov vs. Owen Tippett at Broad Street Hockey (Sat Mar 14, 2026)
-
Recap; Game 65/82: Tippett’s shorthanded goal helps lift Flyers past Wild in shootout at Flyer Nation (Fri Mar 13, 2026)
-
Flyers’ Michkov & Tippett Are Having Similarly Productive Seasons at The Hockey Writers (Fri Mar 13, 2026)
-
Owen Tippett is on fire for the Flyers, and I don’t think he realizes how good he can be at Flyers Nitty Gritty (Fri Mar 13, 2026)
-
Tippett’s Been a Monster – Tired Flyers Outlast Wild at Flyers Nitty Gritty (Fri Mar 13, 2026)
-
Takeaways: Gutsy effort leads Flyers over Wild in 3-2 shootout victory at Broad Street Hockey (Fri Mar 13, 2026)
-
Flyers @ Wild: How to watch, lineups, and gamethread at Broad Street Hockey (Thu Mar 12, 2026)
-
Owen Tippett dominates in every way possible as Flyers beat Capitals at Broad Street Hockey (Thu Mar 12, 2026)
-
Takeaways: Flyers bounce back over Washington with four goals at Broad Street Hockey (Wed Mar 11, 2026)
-
Flyers Back in the Win Column after Beating Capitals 4-1 Wednesday at Philly Hockey Now (Wed Mar 11, 2026)
-
Takeaways: Bump and Barkey shine as Flyers defeat Pittsburgh 4-3 in shootout at Broad Street Hockey (Sat Mar 7, 2026)
-
Why trading Owen Tippett could be a smart move for Philadelphia at Flyers Nitty Gritty (Thu Mar 5, 2026)
-
Deadline Decisions: Evaluating the Flyers’ Potential Trade Chips Before March 6 at Yahoo Sports NHL (Wed Mar 4, 2026)
-
NHL Trade Rumors: Flyers Should Be All-In On Simon Nemec at Yahoo Sports NHL (Wed Mar 4, 2026)
-
Utah Mammoth Should Aggressively Pursue Owen Tippett at The Hockey Writers (Wed Mar 4, 2026)
-
These 2 forwards should be drawing interest from Mathieu Darche and the NY Islanders at Eyes on Isles (Wed Mar 4, 2026)
-
Flyers Trade Deadline: Forecasting Moves & A Bold Prediction at Philly Hockey Now (Wed Mar 4, 2026)
-
Bruins Shouldn’t Spend a Top Prospect on Flyers’ Owen Tippett at The Hockey Writers (Tue Mar 3, 2026)
-
Flyers rival is kicking the trade tires on a potential Owen Tippett deal at Broad Street Buzz (Mon Mar 2, 2026)
-
NHL Rumors: 3 Trade Destinations For Flyers' Owen Tippett at Yahoo Sports NHL (Sun Mar 1, 2026)
-
Takeaways: Vladar sensational as Flyers defeat the Bruins in a tight but exciting 3-1 game at Broad Street Hockey (Sat Feb 28, 2026)
-
Do the Flyers’ top forwards have untapped scoring potential? at Broad Street Hockey (Fri Feb 27, 2026)
-
Bruins reportedly targeting Flyers’ Owen Tippett in trade talks at Broad Street Hockey (Fri Feb 27, 2026)
-
NHL Rumors: Would the Philadelphia Flyers trade Owen Tippett? at NHL Rumors (Tue Feb 17, 2026)
-
Could Flyers trade Owen Tippett at the deadline? NHL insider weighs in at Broad Street Hockey (Wed Feb 11, 2026)
-
Flyers Trade Talk: Could the Trade Deadline Plan Change? at Philly Hockey Now (Sat Feb 7, 2026)
-
3 Flyers who probably don’t want an Olympic break at Broad Street Hockey (Fri Feb 6, 2026)
-
Live updates: Washington Capitals vs Philadelphia Flyers at Xfinity Mobile Arena at Russian Machine Never Breaks (Tue Feb 3, 2026)
-
Flyers Fall 5-2 to Sabres in Disastrous Wednesday Night Matchup at Philly Hockey Now (Thu Jan 15, 2026)
-
Takeaways: Lightning put up a touchdown on Sam Ersson in 7-2 Flyers loss at Broad Street Hockey (Sun Jan 11, 2026)
-
Takeaways: Flyers Close Out West Coast Trip With Victory Over Oilers at Yahoo Sports NHL (Sun Jan 4, 2026)
-
Flyers Naughty or Nice: Who made the list? at Broad Street Hockey (Tue Dec 23, 2025)
-
Takeaways: Flyers rebound with solid 5-2 victory over Vancouver as Michkov breaks goal drought at Broad Street Hockey (Tue Dec 23, 2025)
-
Takeaways: Barkey’s brilliance blown as Flyers choke to Blueshirts 5-4 in shootout at Broad Street Hockey (Sat Dec 20, 2025)
-
Why was Matvei Michkov taken off the Power Play, and benched in overtime? at Flyers Nitty Gritty (Fri Dec 12, 2025)
-
Devils Blockbuster, Jarry Complication, Tippett Unavailable & More NHL Rumours at The Hockey Writers (Sun Dec 7, 2025)
-
NHL Trade Rumors: Flyers Quieting Noise Around Skilled Forward at Yahoo Sports NHL (Sat Dec 6, 2025)
-
Realistic Trade Packages for Quinn Hughes at Flyer Nation (Fri Dec 5, 2025)
-
Gettin Gritty Wit It Episode #294: Did they hit the nail on the head with the Owen Tippett trade rumors? at Flyers Nitty Gritty (Fri Dec 5, 2025)
-
Flyers reportedly trying to shut down Owen Tippett trade rumors at Broad Street Hockey (Fri Dec 5, 2025)
-
Canucks trade rumours: Flyers said no to a trade involving Owen Tippett at Canucks Army (Thu Dec 4, 2025)
-
Flyers’ Owen Tippett reportedly drawing interest from Canucks at Broad Street Hockey (Wed Dec 3, 2025)
-
Flyers – Social Media vs Reality on the Ice at Flyers Nitty Gritty (Sun Nov 30, 2025)
-
Recap; Game 24/82: Owen Tippett’s milestone night locks up Flyers win at Flyer Nation (Sun Nov 30, 2025)
-
Game Breakdown: Tippett and Michkov’s two-goal games lead Flyers over Devils at Flyers Nitty Gritty (Sun Nov 30, 2025)
-
Devils’ Late Comeback Falters, Fall 5-3 To Flyers at Devils Army (Sun Nov 30, 2025)
-
Flyers Beat 1st Place Devils Again! Now Just Two Points Out at Flyers Nitty Gritty (Sun Nov 30, 2025)
-
Tippett’s 3-Point Night Helps Flyers Defeat Devils 5-3 at The Hockey Writers (Sun Nov 30, 2025)
-
Takeaways: Flyers, Vladar hold on for 5-3 win over Devils at Broad Street Hockey (Sun Nov 30, 2025)
-
Flyers’ Owen Tippett scores 100th NHL goal, 200th career point against Devils at Broad Street Hockey (Sat Nov 29, 2025)
-
Flyers’ 3 Stars of the Week: One line stood above the rest at Broad Street Hockey (Mon Nov 17, 2025)
-
Takeaways: One Flyers line dominates Blues in 6-5 shootout win at Broad Street Hockey (Sat Nov 15, 2025)
-
Recap; Game 17/82: Flyers’ one line takes over to beat the Blues at Flyer Nation (Sat Nov 15, 2025)
-
Flyers Beat the Blues Goal-a-palooza in St. Louis at Flyers Nitty Gritty (Sat Nov 15, 2025)
-
Game Breakdown: Zegras, Dvorak help lead Flyers over Blues in back-and-forth battle at Flyers Nitty Gritty (Sat Nov 15, 2025)
-
Rick Tocchet reunites Flyers’ familiar lines in St. Louis at Broad Street Hockey (Fri Nov 14, 2025)
-
Why the Owen Tippett trade rumors won't die at Broad Street Buzz (Fri Nov 14, 2025)
-
Takeaways: Flyers’ overturned goal leads to overtime loss to Edmonton at Broad Street Hockey (Thu Nov 13, 2025)
-
NHL Rumor Roundup: More Owen Tippett Speculation, And The Latest On The Senators at The Hockey News (Wed Nov 12, 2025)
-
Rick Tocchet addresses what he wants from Owen Tippett at Broad Street Hockey (Tue Nov 11, 2025)
-
Flyers News & Rumors: Dvorak’s Value, Tippett’s Slump, & More at The Hockey Writers (Sun Nov 9, 2025)
-
NHL Rumours: Kyrou’s Future, Devils Defensemen & Tippett to the Kings? at The Hockey Writers (Sat Nov 8, 2025)
-
NHL Rumor Mill – November 8, 2025 at Spectors Hockey (Sat Nov 8, 2025)
-
NHL Trade Rumors: Flyers Forward Not Out of the Woods Yet? at Yahoo Sports NHL (Sat Nov 8, 2025)
-
Preview; Game 14/82: Philadelphia Flyers at Nashville Predators at Flyer Nation (Thu Nov 6, 2025)
-
Why the Maple Leafs should have trade interest in Flyers’ Owen Tippett at The Leafs Nation (Thu Nov 6, 2025)
-
Report: Owen Tippett Trade Rumours Persist, Interest Picking Up at Flyer Nation (Wed Nov 5, 2025)
Current Contract
Owen Tippett signed an $49,600,000 8-year contract with the Philadelphia Flyers and General Manager Daniel Briere on January 26, 2024 with an AAV of $6,200,000. This contract will start in 2024-25 and end after the 2031-32 season. In the first season of the contract the cap hit was equivalent to 7.05% of the salary cap.
Standard Contract (RFA) ( ) (0 ratings)
Owen Tippett signed a $3,000,000 2-year contract with the Philadelphia Flyers and General Manager Chuck Fletcher on July 29, 2022 with an AAV of $1,500,000. This contract will start in 2022-23 and end after the 2023-24 season. In the first season of the contract the cap hit was equivalent to 1.82% of the salary cap.
Standard Contract (RFA) ( ) (0 ratings)
| Season | Age* | Clause | Cap Hit | AAV | Perf. Bonus | Sign. Bonus | Salary | Compensation | Minors Salary | Status | |
|---|---|---|---|---|---|---|---|---|---|---|---|
| 2022-23 | 23 | $1,500,000 | $1,500,000 | - | - | $1,250,000 | $1,250,000 | $1,250,000 | RFA | ||
| 2023-24 | 24 | $1,500,000 | $1,500,000 | - | - | $1,750,000 | $1,750,000 | $1,750,000 | RFA-arb | ||
| Total | - | - | $3,000,000 | $3,000,000 | $3,000,000 |
Owen Tippett signed a $2,775,000 3-year contract with the Florida Panthers and General Manager Dale Tallon on July 19, 2017 with an AAV of $925,000. This contract will start in 2017-18 and end after the 2021-22 season. In the first season of the contract the cap hit was equivalent to 1.23% of the salary cap.
Entry Level Contract ( ) (0 ratings)
| Season | Age* | Clause | Cap Hit | AAV | Perf. Bonus | Sign. Bonus | Salary | Compensation | Minors Salary | Status | |
|---|---|---|---|---|---|---|---|---|---|---|---|
| 2017-18 | 18 | $925,000 | $1,658,333 | - | $92,500 | - | $92,500 | - | ELC | ||
| 2018-19 | 19 | $894,167 | $1,627,500 | - | $92,500 | - | $92,500 | - | ELC | ||
| 2019-20 | 20 | $863,333 | $1,596,667 | $500,000 | $92,500 | $832,500 | $925,000 | $70,000 | ELC | ||
| 2020-21 | 21 | $863,333 | $1,596,667 | $850,000 | - | $832,500 | $832,500 | $70,000 | ELC | ||
| 2021-22 | 22 | $863,333 | $1,596,667 | $850,000 | - | $832,500 | $832,500 | $70,000 | ELC | ||
| Total | $2,200,000 | $277,500 | $2,497,500 | $2,775,000 | $210,000 |
Career Statistics
| Regular Season | Playoffs | |||||||||||||||||||
|---|---|---|---|---|---|---|---|---|---|---|---|---|---|---|---|---|---|---|---|---|
| Season | League | Team | GP | G | A | Pts | +/- | PIM | Shots | Sh% | TOI/G | GP | G | A | Pts | +/- | PIM | Shots | Sh% | TOI/G |
| 2008-09 | Brick Invitational | Toronto Bulldogs | 5 | 1 | 0 | 1 | 5 | 1 | 1 | |||||||||||
| 2013-14 | GTMMHL | Toronto Red Wings Min Midget AAA | 31 | 15 | 6 | 21 | 8 | |||||||||||||
| 2014-15 | GTMMHL | Toronto Red Wings Min Midget AAA | 50 | 52 | 35 | 87 | ||||||||||||||
| 2014-15 | OJHL | Toronto Jr. Canadiens | 6 | 2 | 1 | 3 | 2 | |||||||||||||
| 2014-15 | CWG | Team Ontario | 6 | 2 | 6 | 8 | ||||||||||||||
| 2014-15 | OGC-16 | Team GTHL Red | 5 | 3 | 3 | 2 | ||||||||||||||
| 2015-16 | WJC-18 | Canada U18 | 7 | 1 | 2 | 3 | +2 | 12 | ||||||||||||
| 2015-16 | WHC-17 | Canada White U17 | 6 | 5 | 3 | 8 | ||||||||||||||
| 2015-16 | U17-Dev | Team Gold | 3 | 1 | 0 | 1 | 4 | |||||||||||||
| 2015-16 | OHL | Mississauga Steelheads | 48 | 15 | 5 | 20 | -2 | 10 | 7 | 1 | 2 | 3 | 4 | |||||||
| 2016-17 | Ivan Hlinka Memorial | Canada U18 | 4 | 1 | 1 | 2 | +1 | |||||||||||||
| 2016-17 | OHL | Mississauga Steelheads | 60 | 44 | 31 | 75 | +24 | 36 | 20 | 10 | 9 | 19 | +11 | 14 | ||||||
| 2016-17 | OHL | Brampton Steelheads | 60 | 44 | 31 | 75 | +24 | 36 | 20 | 10 | 9 | 19 | +11 | 14 | ||||||
| 2017-18 | NHL | Florida Panthers | 7 | 1 | 0 | 1 | -6 | 17 | 5.9 | 11:07 | ||||||||||
| 2017-18 | AHL | Springfield Thunderbirds | 5 | 1 | 1 | 2 | +2 | 2 | ||||||||||||
| 2017-18 | OHL | Brampton Steelheads | 51 | 36 | 39 | 75 | +1 | 30 | 6 | 3 | 2 | 5 | -2 | 4 | ||||||
| 2017-18 | OHL | Mississauga Steelheads | 51 | 36 | 39 | 75 | +1 | 30 | 6 | 3 | 2 | 5 | -2 | 4 | ||||||
| 2018-19 | OHL | Mississauga Steelheads | 23 | 19 | 14 | 33 | +7 | 10 | ||||||||||||
| 2018-19 | OHL | Brampton Steelheads | 23 | 19 | 14 | 33 | +7 | 10 | ||||||||||||
| 2018-19 | WJC-20 | Canada U20 | 5 | 2 | 2 | 4 | +5 | |||||||||||||
| 2018-19 | OHL | Saginaw Spirit | 31 | 14 | 27 | 41 | +21 | 8 | 17 | 11 | 11 | 22 | +4 | |||||||
| 2019-20 | AHL | Springfield Thunderbirds | 46 | 19 | 21 | 40 | +12 | 18 | ||||||||||||
| 2020-21 | NHL | Florida Panthers | 45 | 7 | 11 | 18 | -5 | 6 | 86 | 8.1 | 11:29 | 6 | 1 | 3 | 4 | -1 | 14 | 7.1 | 13:38 | |
| 2021-22 | NHL | Florida Panthers | 42 | 6 | 8 | 14 | +2 | 10 | 73 | 8.2 | 12:32 | |||||||||
| 2021-22 | NHL | Philadelphia Flyers | 21 | 4 | 3 | 7 | -4 | 2 | 53 | 7.5 | 15:12 | |||||||||
| 2021-22 | AHL | Charlotte Checkers | 12 | 6 | 12 | 18 | -1 | 2 | ||||||||||||
| 2022-23 | NHL | Philadelphia Flyers | 77 | 27 | 22 | 49 | -17 | 16 | 231 | 11.7 | 17:26 | |||||||||
| 2023-24 | NHL | Philadelphia Flyers | 78 | 28 | 25 | 53 | -5 | 12 | 289 | 9.7 | 16:35 | |||||||||
| 2024-25 | NHL | Philadelphia Flyers | 77 | 20 | 23 | 43 | -12 | 16 | 188 | 10.6 | 16:00 | |||||||||
| 2025-26 | NHL | Philadelphia Flyers | 81 | 28 | 23 | 51 | -6 | 32 | 220 | 12.7 | 16:51 | 6 | 1 | 1 | 2 | +2 | 9 | 11.1 | 17:14 | |
| NHL Career | 428 | 121 | 115 | 236 | -53 | 94 | 1157 | 10.4 | 15:35 | 12 | 2 | 4 | 6 | +1 | 23 | 8.7 | 15:26 | |||