
 Jack Hughes
| Position | Center | Current Team | New Jersey Devils |
| Shoots | Left | Current Contract | 8 years ($8.0M CapHit) |
| Height | 5'11" | Expires | 2029-30 |
| Weight (lbs) | 175 | Expiry Age (Jun 30) | 29 |
| Age (DOB) | 25 (May 14, 2001) | Expiry Status | UFA |
| Drafted | 2019, Round 1, Overall 1 (NJD) |
| Date | Team | Transaction | |
|---|---|---|---|
| Dec 21, 2025 | New Jersey Devils | Activated from IR | |
| Dec 17, 2025 | New Jersey Devils | Placed on LTIR | |
| Nov 18, 2025 | New Jersey Devils | Placed on IR | |
| Mar 5, 2025 | New Jersey Devils | Placed on LTIR | |
| Nov 30, 2021 | New Jersey Devils | Signed 8 years @ $8.000M AAV starting in 2022-23 | |
| Jul 12, 2019 | New Jersey Devils | Signed to an entry level contract. |
Player Card(s)
URL: https://thestanleycap.com/cdn/player_cards/20252026/jack-hughes-8481559.png

URL: https://thestanleycap.com/cdn/player_cards/20242025/jack-hughes-8481559.png

URL: https://thestanleycap.com/cdn/player_cards/20232024/jack-hughes-8481559.png
About Player Cards
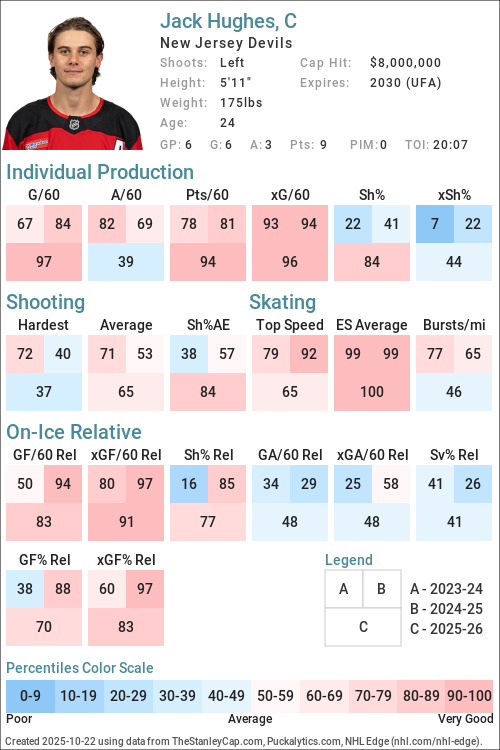
Player cards present an infographic of a players performance using a series of Player Archetypes developed for Puckalytics.com and TheStanleyCap.com. The boxes in the rink image show the archetype ratings for the season specified in the card while the graphs to the right show the five-year trends for those archetypes.
Except for Faceoffs, the values shown are the players z-score (standard deviation from the mean) for the specific metric used to calculate the archetype values. When calculating z-scores forwards were compared to forwards and defensemen were compared to defensemen. Positive values indicate the player is above average and shaded in blue, while negative values indicate the player is below average and shaded in pink. The five year trend charts show a range of -4.0 to 4.0.
The value shown for Faceoffs is the faceoff winning percentage rather than their z-score with winning percentages below 50 in pink shades and above 50 in blue shades.
All archetypes are 5v5 except 5v4 TOI, 4v5 TOI, Skating (even strength) and Faceoffs (all situations). Archetypes use regular season data only.
Archetypes Summary
- Sniper - Measures the to score above the expected goal rate.
- Rebound - Measures the percent of a players shot attempts that come from rebounds (forwards only).
- 5v4 TOI - Powerplay ice time, calculated as the percentage of his teams 5v4 ice time that the player was on the ice for.
- Shooter - Measures whether a players points come from shots (goals or assists on rebounds from his shots).
- Producer - Measures a players ability to produce goals and assists, adjusted for quality of teammates.
- Playmaker - Measures whether a players points come from passes.
- Drive - Measures a players ability to drive puck possession and generate shot attempts for his team.
- Rush - Measures the percent of a players shot attempts that come from rush plays
- Possession - An indicator of a players ability to improve his teams puck possession game.
- Faceoffs - Faceoff Winning Percentage (min. 75 faceoffs taken).
- 5v5 TOI - The percentage of his teams 5v5 TOI that the player was on the ice for.
- Suppress - Measures a players ability to suppress opponent puck possession and shot attempts against.
- Skating - An indicator of a players skating ability, or speed bursts above 20mph per mile skated.
- Defend - An indicator of a players ability to suppress shot quality against.
- 4v5 TOI - Penalty Kill ice time, calculated as the percentage of his teams 4v5 ice time that the player was on the ice for.
Data Sources
- Salary data is from TheStanleyCap.com
- Skating data is from NHL Edge
- Other statistics are from Puckalytics.com and derived from data from NHL.com
Terms of Use
You are free to use include player cards in written articles, share on social media, or on other public websites under the following conditions:
- You credit TheStanleyCap.com as the source and provide a link back to TheStanleyCap.com or this player page.
- You do not mass copy/duplicate/publish dozens or hundreds of player cards. A few, or a handful for a written article is fine. Be reasonable. Fair use rules apply.
- If you are a high-traffic website you must download and host the image(s) on your site rather than overload TheStanleyCap servers with traffic.
Note: Player cards will update daily throughout the season so if you want to include snapshot then you must download the image.
If you have any questions, send an e-mail to the e-mail address at the top of this page.
Read Introducing Player Archetypes on HockeyAnalysis.com for more details on archetype calculations.
Core Archetypes
| Season | Team(s) | GP | TOI | Producer | Playmaker | Shooter | Sniper | Rebound | Rush | Skating | Defend |
|---|---|---|---|---|---|---|---|---|---|---|---|
| 2019-20 | NJD | 61 | -0.99 | 0.22 | -1.30 | -2.49 | 0.40 | 0.36 | - | 0.41 | |
| 2020-21 | NJD | 56 | -0.68 | -0.80 | -0.13 | -0.14 | -0.37 | 0.18 | - | -0.09 | |
| 2021-22 | NJD | 49 | 1.38 | -0.36 | 2.45 | 0.45 | -0.28 | 1.03 | 0.16 | -0.55 | |
| 2022-23 | NJD | 78 | 2.22 | 0.38 | 2.42 | 0.87 | -0.78 | -0.06 | 0.25 | -1.98 | |
| 2023-24 | NJD | 62 | 1.05 | 0.98 | 0.28 | -0.29 | -0.31 | 0.33 | 0.60 | -0.22 | |
| 2024-25 | NJD | 62 | 0.62 | -0.12 | 0.82 | 0.04 | -1.09 | 1.86 | 0.29 | -0.55 | |
| 2025-26 | NJD | 61 | 1.29 | -0.01 | 1.75 | 0.37 | -1.36 | 0.72 | -0.13 | -0.84 |
Situational and Secondary Archetypes
| Season | Team(s) | GP | TOI | 5v5 TOI | 5v4 TOI | 4v5 TOI | Possession | Drive | Suppress | Faceoffs |
|---|---|---|---|---|---|---|---|---|---|---|
| 2019-20 | NJD | 61 | -0.15 | 0.76 | -1.89 | -0.19 | 0.12 | -0.64 | 36.1 | |
| 2020-21 | NJD | 56 | 1.47 | 1.06 | -2.12 | 1.63 | 0.89 | 1.86 | 35.4 | |
| 2021-22 | NJD | 49 | 1.61 | 0.99 | -1.95 | 0.15 | 0.62 | -0.73 | 34.6 | |
| 2022-23 | NJD | 78 | 1.72 | 1.34 | -1.85 | 0.86 | 0.71 | 0.49 | 35.3 | |
| 2023-24 | NJD | 62 | 1.94 | 1.59 | -1.94 | 0.98 | 1.30 | -0.15 | 37.2 | |
| 2024-25 | NJD | 62 | 1.73 | 1.39 | -0.83 | 1.69 | 1.76 | 0.34 | 37.6 | |
| 2025-26 | NJD | 61 | 2.21 | 1.37 | -1.33 | 1.49 | 1.12 | 0.86 | 34.8 |
5v5 Individual Stats
| Season | Team(s) | GP | TOI | G/60 | A/60 | Pts/60 | xG/60 | GAE/60 | Sh% | xSh% | Sh%AE | %SA Rush | %SA Reb. |
|---|---|---|---|---|---|---|---|---|---|---|---|---|---|
| 2019-20 | NJD | 61 | 700:50 | 0.17 | 0.77 | 0.94 | 0.81 | -0.64 | 2.44 | 11.51 | -9.07 | 4.63 | 7.41 |
| 2020-21 | NJD | 56 | 830:20 | 0.72 | 0.65 | 1.37 | 0.76 | -0.04 | 9.17 | 9.69 | -0.51 | 4.11 | 4.79 |
| 2021-22 | NJD | 49 | 739:10 | 1.30 | 1.22 | 2.52 | 1.14 | 0.15 | 13.22 | 11.65 | 1.58 | 6.06 | 5.45 |
| 2022-23 | NJD | 78 | 1185:15 | 1.42 | 1.37 | 2.78 | 1.13 | 0.29 | 12.84 | 10.21 | 2.63 | 3.66 | 4.76 |
| 2023-24 | NJD | 62 | 961:24 | 0.81 | 1.25 | 2.06 | 0.93 | -0.12 | 7.30 | 8.34 | -1.03 | 4.56 | 7.05 |
| 2024-25 | NJD | 62 | 944:53 | 0.95 | 1.08 | 2.03 | 0.95 | 0.00 | 9.93 | 9.90 | 0.04 | 5.26 | 4.31 |
| 2025-26 | NJD | 61 | 1014:53 | 1.06 | 1.00 | 2.07 | 0.99 | 0.08 | 11.46 | 10.63 | 0.84 | 3.76 | 3.76 |
5v5 On Ice Stats
| Season | Team(s) | GP | TOI | SAF/60 | GF/60 | xGF/60 | SAA/60 | GA/60 | xGA/60 | GF% | xGF% | xGF Rel | xGA Rel | xGF% Rel |
|---|---|---|---|---|---|---|---|---|---|---|---|---|---|---|
| 2019-20 | NJD | 61 | 700:50 | 39.21 | 1.46 | 2.61 | 47.09 | 2.83 | 2.88 | 34.00 | 47.50 | 0.28 | 0.20 | 1.07 |
| 2020-21 | NJD | 56 | 830:20 | 43.07 | 2.53 | 2.59 | 37.07 | 2.46 | 2.28 | 50.72 | 53.13 | 0.24 | -0.32 | 5.71 |
| 2021-22 | NJD | 49 | 739:10 | 46.35 | 3.41 | 3.15 | 45.13 | 4.06 | 2.67 | 45.65 | 54.13 | 0.41 | -0.01 | 3.51 |
| 2022-23 | NJD | 78 | 1185:15 | 49.36 | 3.54 | 3.43 | 38.17 | 2.94 | 2.46 | 54.69 | 58.28 | 0.39 | -0.01 | 3.06 |
| 2023-24 | NJD | 62 | 961:24 | 48.87 | 2.68 | 2.78 | 41.44 | 2.87 | 2.56 | 48.31 | 52.07 | 0.25 | 0.18 | 0.45 |
| 2024-25 | NJD | 62 | 944:53 | 46.67 | 3.11 | 2.98 | 39.75 | 2.22 | 2.27 | 58.33 | 56.77 | 0.80 | -0.08 | 8.66 |
| 2025-26 | NJD | 61 | 1014:53 | 46.17 | 2.54 | 3.00 | 37.01 | 2.90 | 2.65 | 46.74 | 53.09 | 0.60 | 0.10 | 4.54 |
NHL Edge Stats
| Skating | Shooting | Zone Time | |||||||||||
|---|---|---|---|---|---|---|---|---|---|---|---|---|---|
| Season | GP | Top Speed | Bursts>20/mi | Avg. Speed | Top Speed | Avg. Speed | %Long Range | %Mid Range | %High Danger | ES DZ% | ES NZ% | ES OZ% | |
| This table is for Basic and Premium subscribers only. To view please login to and/or subscribe to one of our subscription plans. | |||||||||||||
Legend
| Percentile 0-25 | Percentile 25-50 | Percentile 50-75 | Percentile 75-100 |
5v5 Lines
| Season | Teammate | Teammate | Team | TOI | GF/60 | GA/60 | GF% | xGF/60 | xGA/60 | xGF% | xGF Rel | xGA Rel | xGF% Rel |
|---|
Glossary
| Type | Statistic | Definition |
|---|---|---|
| Individual | G/60 | Goals Against per 60 minutes. |
| Individual | A/60 | Assists per 60 minutes. |
| Individual | Pts/60 | Points per 60 minutes. |
| Individual | xG/60 | Expected Goals per 60 minutes. |
| Individual | GAE/60 | Goals Above Expected (G/60 - xG/60). |
| Individual | Sh% | Shooting Percentage. |
| Individual | xSh% | Expected Shooting Percentage. |
| Individual | Sh%AE | Shooting percentage above expected (Sh% - xSh%). |
| Individual | %SA Rush | Percentage of shot attempts determined to be on the rush. |
| Individual | %SA Reb. | Percentage of shot attempts determined to be from rebounds. |
| On Ice | SAF/60 | Shot Attempts For per 60 minutes. |
| On Ice | GF/60 | Goals For per 60 minutes. |
| On Ice | xGF/60 | Expected Goals For per 60 minutes. |
| On Ice | SAA/60 | Shot Attempts Against per 60 minutes (lower is better). |
| On Ice | GA/60 | Goals Against per 60 minutes (lower is better). |
| On Ice | xGA/60 | Expected Goals Against per 60 minutes (lower is better). |
| On Ice | GF% | Goals For Percentage = Goals For / (Goals For + Goals Against) |
| On Ice | xGF% | Expected Goals For Percentage = Expected Goals For / (Expected Goals For + Expected Goals Against) |
| On Ice | xGF Rel | xGF/60 when On Ice - xGF/60 when not On Ice. |
| On Ice | xGA Rel | xGA/60 when On Ice - xGA/60 when not On Ice (lower is better). |
| On Ice | xGF% Rel | xGF% when On Ice - xGF% when not On Ice. |
News and Opinions
-
La famille Hughes frappée par un deuil at HABSolument Fan (Fri Jul 31, 2026)
-
NHL Rumors: Celebrini’s Deal, Hughes Extension, DeBrincat Trade… at The Hockey Writers (Wed Jul 29, 2026)
-
Projecting the New Jersey Devils’ 2026-27 Lineup at The Hockey Writers (Wed Jul 29, 2026)
-
NHL Morning Coffee Headlines – July 29, 2026 at Spectors Hockey (Wed Jul 29, 2026)
-
Devils in the Details – 7/29/26: Hughes News Edition at All About the Jersey (Wed Jul 29, 2026)
-
Jack Hughes' Hart Trophy odds show confidence in his talent and the organization at Pucks and Pitchforks (Tue Jul 28, 2026)
-
Quinn Hughes negotiations are finally starting to heat up for the Wild at Gone Puck Wild (Tue Jul 28, 2026)
-
Devils News & Rumors: Potential Kirill Marchenko Trade, Matias Vanhanen Commits to BC, and More at The Hockey Writers (Tue Jul 28, 2026)
-
Which forward makes the most sense next to Jack Hughes? at Pucks and Pitchforks (Tue Jul 28, 2026)
-
Wild players think Quinn Hughes will figure out extension with Minnesota at Gone Puck Wild (Mon Jul 27, 2026)
-
Nick Foligno sends warning to Quinn Hughes about potential family reunion in NHL at Gone Puck Wild (Mon Jul 27, 2026)
-
Luke Hughes's last name is actually working against him at Pucks and Pitchforks (Mon Jul 27, 2026)
-
Kent Hughes and the Canadiens pull off a masterstroke with the NHL's best signing at Habs Fanatics (Sun Jul 26, 2026)
-
Daily Bean: Bruins Prospect Roundup; Marchenko Report; Hughes Reunion Talk at Boston Hockey Now (Sun Jul 26, 2026)
-
Sportsnet place Slafkovsky devant Jack Hughes pour les cinq prochaines années at Dans Les Coulisses (Wed Jul 22, 2026)
-
Does Robert Thomas belong in the same conversation as Jack Hughes, Tim Stützle, and Dylan Larkin? at Bleedin' Blue (Mon Jul 20, 2026)
-
Anthony Mantha Vs. The Metropolitan Division at All About the Jersey (Mon Jul 20, 2026)
-
Connor Bedard's contact reinforces Tom Fitzgerald's greatest success with the New Jersey Devils at Pucks and Pitchforks (Sat Jul 18, 2026)
-
Anthony Mantha is a fantastic fit alongside Jack Hughes and Jesper Bratt at Pucks and Pitchforks (Thu Jul 16, 2026)
-
Jack Hughes is nominated for the strangest award at Pucks and Pitchforks (Wed Jul 15, 2026)
-
If Only Hughes Had Accepted Red Wings Invite. . . at Detroit Hockey Now (Tue Jul 14, 2026)
-
This Jack Hughes rumor reeks of Bill Guerin's desperation at Pucks and Pitchforks (Sun Jul 12, 2026)
-
Jack Hughes may be the Wild’s best pivot over Dylan Larkin at Gone Puck Wild (Sat Jul 11, 2026)
-
Voici à quoi ressemblera le prochain contrat de Quinn Hughes avec le Wild at HABSolument Fan (Fri Jul 10, 2026)
-
Bill Guerin tried breaking the NHL with blockbuster trade attempt to appease Quinn Hughes at Gone Puck Wild (Mon Jul 6, 2026)
-
Some Analysis On Sunny Mehta’s First Offseason With The New Jersey Devils at All About the Jersey (Mon Jul 6, 2026)
-
Voici les dossiers encore sur le bureau de Kent Hughes at Dans Les Coulisses (Mon Jul 6, 2026)
-
Le Wild a tenté de faire l'acquisition de Jack Hughes at HABSolument Fan (Sun Jul 5, 2026)
-
Jack Hughes échangé au Wild : des journalistes ouvrent la porte at Dans Les Coulisses (Sun Jul 5, 2026)
-
NHL Rumours: Robertson Arbitration, Jack Hughes to Wild & Wright To Habs? at The Hockey Writers (Sun Jul 5, 2026)
-
An Exercise in Analytics: What Would the Ideal Devils Forward Lineup Be? at All About the Jersey (Sat Jul 4, 2026)
-
The Eve of Free Agency: Fourteen Players the Devils Could Add at All About the Jersey (Tue Jun 30, 2026)
-
3 veteran free agent targets the New Jersey Devils should target at Pucks and Pitchforks (Mon Jun 29, 2026)
-
The New Jersey Devils have officially been tied to Detroit Red Wings star forward at Pucks and Pitchforks (Sun Jun 28, 2026)
-
Bill Guerin's comments on Quinn Hughes have the internet split on the star defenseman's future at Pucks and Pitchforks (Sun Jun 28, 2026)
-
The Best NHL Value Contracts Fuel 2027 Cup Dreams at NHL Rumors (Fri Jun 26, 2026)
-
Minnesota Wild owner's comments on Quinn Hughes are not concerning for New Jersey Devils' fans at Pucks and Pitchforks (Thu Jun 25, 2026)
-
Le propriétaire du Wild donne une mise à jour majeure sur le dossier Quinn Hughes at HABSolument Fan (Thu Jun 25, 2026)
-
Wild owner Craig Leipold says Quinn Hughes will re-sign in Minnesota at Canucks Army (Thu Jun 25, 2026)
-
Jack Hughes trade "rumors" don't make much sense for the New Jersey Devils at Pucks and Pitchforks (Mon Jun 22, 2026)
-
Jack Hughes gets an unlikely ally in his pursuit of the Golden Goal puck from the Hockey Hall of Fame at Pucks and Pitchforks (Sat Jun 20, 2026)
-
Sunny Mehta acknowledge's New Jersey Devils recent hurdle at Pucks and Pitchforks (Sat Jun 13, 2026)
-
NHL Rumors: Detroit Red Wings and Minnesota Wild at NHL Rumors (Sat Jun 13, 2026)
-
Jack Hughes almost had as many Hart Trophy votes as Quinn Hughes at Pucks and Pitchforks (Thu Jun 11, 2026)
-
Instead of Dylan Larkin the New Jersey Devils should try to trade for this center at Pucks and Pitchforks (Wed Jun 10, 2026)
-
Bold Predictions for the 2026-27 New Jersey Devils at The Hockey Writers (Wed Jun 10, 2026)
-
The Best Devils Team to Never Win The Stanley Cup With Them at All About the Jersey (Wed Jun 10, 2026)
-
The Best Devils Team to Never Win The Stanley Cup With Them at Yahoo Sports NHL (Wed Jun 10, 2026)
-
Jack Hughes gets another honor, this time from Time Magazine at Pucks and Pitchforks (Tue Jun 9, 2026)
-
3 Bold Trade Scenarios for the Montreal Canadiens This Summer at The Hockey Writers (Mon Jun 8, 2026)
-
Should the Devils Pursue Another Top Center? at All About the Jersey (Sat Jun 6, 2026)
-
New Jersey Devils’ Top 10 Moments From the 2025-26 Season at The Hockey Writers (Fri Jun 5, 2026)
-
Three NHL Free Agent Destinations For Panthers' A.J. Greer at Yahoo Sports NHL (Wed Jun 3, 2026)
-
The Wild Should At Least Explore A Jack Hughes Trade at Hockey Wilderness (Mon Jun 1, 2026)
-
'The Crowd In Buffalo Is Incredible': Jack Hughes Praise Sabres Fans at Yahoo Sports NHL (Thu May 21, 2026)
-
Trading Nico Hischier for Quinn Hughes is bad for the New Jersey Devils at Pucks and Pitchforks (Wed May 20, 2026)
-
Devils Potential Trade Targets at Forward at All About the Jersey (Wed May 20, 2026)
-
Jack Hughes reveals the rival arena he calls the "hardest rink to play in" at Pucks and Pitchforks (Tue May 19, 2026)
-
Jack Hughes est heureux de voir le parcours du Canadien se poursuivre en séries at Dans Les Coulisses (Tue May 19, 2026)
-
Ex-Canucks captain Quinn Hughes ‘definitely’ open to re-signing with the Wild at Canucks Army (Tue May 19, 2026)
-
Bill Guerin is determined to trade for one of Quinn Hughes’ brothers at Gone Puck Wild (Mon May 18, 2026)
-
NHL Rumor Mill – May 16, 2026 at Spectors Hockey (Sat May 16, 2026)
-
Stunning new report has linked the Rangers to the ultimate offseason blockbuster trade at Blue Line Station (Sat May 16, 2026)
-
Don't overreact to a phone call, even when it involves a Hughes brothers trade proposal at Pucks and Pitchforks (Fri May 15, 2026)
-
Quinn Hughes's comments in his postseason press conference aren't surprising or worrisome at Pucks and Pitchforks (Fri May 15, 2026)
-
Report claims that Bill Guerin tried to get a second Hughes brother on his team this season at Pucks and Pitchforks (Fri May 15, 2026)
-
RUMEUR : le Wild a essayé d’acquérir Luke Hughes at Dans Les Coulisses (Fri May 15, 2026)
-
Top analyst is quick to tell New Jersey Devils fans, "Don't expect Quinn Hughes anytime soon" at Pucks and Pitchforks (Thu May 14, 2026)
-
DAB Report Card: Jack Hughes, F at Devils Army (Mon May 11, 2026)
-
"Those are possibilities"; Quinn Hughes's agent leaks his thoughts on the star defenseman's next contract at Pucks and Pitchforks (Thu May 7, 2026)
-
Jack Hughes’ Impact on Devils in 2025-26 Was Staggering at The Hockey Writers (Fri May 1, 2026)
-
New Jersey Devils rival steals Jack Hughes's move after first-round series winner at Pucks and Pitchforks (Thu Apr 30, 2026)
-
What was once seemingly inevitable, Jack Hughes will never win this award in his career at Pucks and Pitchforks (Tue Apr 28, 2026)
-
A More Modern Team: How the Devils Can Lean on their Best Players Next Season at All About the Jersey (Sun Apr 26, 2026)
-
Devils GM Sunny Mehta's first conversation with Jack Hughes didn't start with hockey at Pucks and Pitchforks (Sat Apr 25, 2026)
-
Latest Quinn Hughes-Detroit Red Wings rumor should make Sunny Mehta smile at Pucks and Pitchforks (Fri Apr 24, 2026)
-
Devils’ Top 3 Players From This Season at The Hockey Writers (Wed Apr 22, 2026)
-
Jack Hughes is already eligible for the Hall of Fame representing New Jersey at Pucks and Pitchforks (Mon Apr 20, 2026)
-
The All About the Jersey Awards for the 2025-26 New Jersey Devils at All About the Jersey (Sun Apr 19, 2026)
-
New Jersey Devils’ 2025-26 Season Awards at The Hockey Writers (Sat Apr 18, 2026)
-
On the Last Day of the Devils Season: Team Award Nominees and Loose Thoughts From a Difficult Year at All About the Jersey (Tue Apr 14, 2026)
-
Hischier Plays Hero; Devils Notch 4-3 Home Finale Win at Devils Army (Mon Apr 13, 2026)
-
Sorry Cole Caufield, Jack Hughes is still the best player from the 2019 NHL Draft at Pucks and Pitchforks (Sun Apr 12, 2026)
-
Red Wings-Devils Tweetcap: End of the line at The Malik Report (Sat Apr 11, 2026)
-
Devils Travel To Detroit For First Of Back-To-Back Set at Devils Army (Sat Apr 11, 2026)
-
Devils’ Jack Hughes Nominated for King Clancy Trophy at The Hockey Writers (Fri Apr 10, 2026)
-
Olympic hero Jack Hughes has new chiclets as NHL dentists get a moment in the spotlight at NBC Sports (Thu Apr 9, 2026)
-
Olympic hero Jack Hughes has new chiclets as NHL dentists get a moment in the spotlight at Yahoo Sports NHL (Thu Apr 9, 2026)
-
Devils Leadership group feels responsible for Tom Fitzgerald's departure at Pucks and Pitchforks (Wed Apr 8, 2026)
-
5 biggest focuses for next New Jersey Devils general manager at Pucks and Pitchforks (Tue Apr 7, 2026)
-
5 biggest mistakes of Tom Fitzgerald's New Jersey Devils career at Pucks and Pitchforks (Mon Apr 6, 2026)
-
Devils Shutout Montreal To Reach 40 Wins at Devils Army (Mon Apr 6, 2026)
-
DitD & Open Post - 4/6/26: First Pitch Edition at Yahoo Sports NHL (Mon Apr 6, 2026)
-
Canadiens vs. Devils Top Six Minutes: The winning streak ends at eight at Habs Eyes on the Prize (Sun Apr 5, 2026)
-
Jack Hughes reacts to good friend Cole Caufield sitting one goal away from 50 at Habs Fanatics (Sun Apr 5, 2026)
-
Devils Almost Pull Off Comeback, But Allen Allows Three Shootout Goals in 4-3 Loss to Canadiens at All About the Jersey (Sat Apr 4, 2026)
-
Canadiens @ Devils Top Six Minutes: Perfection on the road at Habs Eyes on the Prize (Sat Apr 4, 2026)
-
Hughes, Bratt Lead Devils To 7-3 Blowout Of Capitals at Devils Army (Fri Apr 3, 2026)
-
Devils in the Details – 4/3/26: Something To Build On Edition at All About the Jersey (Fri Apr 3, 2026)
-
Spoiler Alert! Devils Rout Caps Behind Bratt, Hughes at All About the Jersey (Fri Apr 3, 2026)
-
Jack Hughes' 5-point game powers the Devils to a 7-3 win over the Capitals at Yahoo Sports NHL (Thu Apr 2, 2026)
-
New York sports talk host has insane reason for booing Jack Hughes at Pucks and Pitchforks (Thu Apr 2, 2026)
-
Devils Need Jack Hughes' Hot Streak To Stretch Over An 82-Game Season at The Hockey News (Thu Apr 2, 2026)
-
New Jersey Devils Fall Flat In 4-1 Loss To New York Rangers at All About the Jersey (Tue Mar 31, 2026)
-
3 Keys to a Devils’ Season Sweep Over the Rangers at The Hockey Writers (Tue Mar 31, 2026)
-
Devils Wrap Up Season Series Against The Rangers In New York at Devils Army (Tue Mar 31, 2026)
-
Can this version of Jack Hughes exist in the playoffs? at Pucks and Pitchforks (Mon Mar 30, 2026)
-
Some Things I’d Like To See Down The Stretch at All About the Jersey (Mon Mar 30, 2026)
-
Hughes’ Four Point Night Leads Devils To Win Over Blackhawks at Devils Army (Mon Mar 30, 2026)
-
Top-4 : Les Flyers sont à deux points des séries at Dans Les Coulisses (Mon Mar 30, 2026)
-
When the Sun Goes Down: Devils 5, Blackhawks 3 at Second City Hockey (Mon Mar 30, 2026)
-
Blackhawks Crumble Late, Lose 5-3 To Devils To Finish Road Trip at Chicago Hockey Now (Sun Mar 29, 2026)
-
Jack Hughes scores twice as Devils rally past Blackhawks 5-3 at Yahoo Sports NHL (Sun Mar 29, 2026)
-
Jack Hughes scores twice as Devils rally past Blackhawks 5-3 at Yahoo Sports NHL (Sun Mar 29, 2026)
-
Fanbase is split on Luke Hughes vs. Simon Nemec for the best young defenseman on the Devils at Pucks and Pitchforks (Sun Mar 29, 2026)
-
Blackhawks Vs Devils: Projected Lineup, How To Watch, & More Ahead Of Game 74 at Yahoo Sports NHL (Sun Mar 29, 2026)
-
Game Preview #72: New Jersey Devils @ Carolina Hurricanes at All About the Jersey (Sat Mar 28, 2026)
-
Devils Continue To Roll In 4-2 Defeat Of Nashville at Devils Army (Fri Mar 27, 2026)
-
Nico Hischier Scores Twice In New Jersey Devils’ 4-2 Win Over Nashville Predators at All About the Jersey (Fri Mar 27, 2026)
-
The Devils should thank the Maple Leafs & Oilers for ending this Jack Hughes narrative at Pucks and Pitchforks (Thu Mar 26, 2026)
-
Devils Continue Road Trip Against Nashville at Devils Army (Thu Mar 26, 2026)
-
Hold On: Devils Outlast Stars 6-4 at All About the Jersey (Wed Mar 25, 2026)
-
Jack Hughes is sending himself into a new stratosphere since his Golden Goal at Pucks and Pitchforks (Wed Mar 25, 2026)
-
Jack Hughes scores two goals as Devils hold on for 6-4 win over Stars at Yahoo Sports NHL (Wed Mar 25, 2026)
-
Jack Hughes scores twice in a 4-goal 1st for Devils as Stars lose 2nd straight in regulation at Yahoo Sports NHL (Tue Mar 24, 2026)
-
Jack Hughes says this phone call was "most surreal" after scoring the Golden Goal at Pucks and Pitchforks (Tue Mar 24, 2026)
-
What has changed for Jack Hughes one month after Olympic golden goal? at ESPN (Mon Mar 23, 2026)
-
Hughes brothers take photo with Alex Ovechkin’s sons after Capitals-Devils game at Russian Machine Never Breaks (Sat Mar 21, 2026)
-
Cody Glass and Arseny Gritsyuk Deserve Massive Role Increases at All About the Jersey (Sat Mar 21, 2026)
-
Devils News & Rumors: Matthew Knies, Potential GM Demotion & Jack’s Dominance at The Hockey Writers (Sat Mar 21, 2026)
-
Cole Hutson dazzles against Devils with unbelievable move around defender, gets into physical battle with Jack Hughes at Russian Machine Never Breaks (Fri Mar 20, 2026)
-
Vincent Trocheck comes to Jack Hughes’ defense over golden puck controversy at Blue Line Station (Thu Mar 19, 2026)
-
Sidney Crosby fait mal paraître Jack Hughes avec cette déclaration de grande classe at HABSolument Fan (Thu Mar 19, 2026)
-
Jack Hughes Is Not Dumb For Suggesting The Devils Have A Chance At The Playoffs at The Hockey News (Thu Mar 19, 2026)
-
Devils Demolish Rangers In 6-3 Thumping at Devils Army (Thu Mar 19, 2026)
-
Jack Hughes on Olympic golden goal puck in Hockey Hall of Fame: 'Honored that it's there' at NBC Sports (Thu Mar 19, 2026)
-
NYR/NJD 3/18 Review: Jack Hughes Dominates and “Daddy’s” The Blueshirts Again; Rangers Doubled-Up Once More Too, Another Lengthy SOG Drought; Sully’s Squad Sustains Two Injuries, Special Bus Special Teams Won’t Motor, Quick Left To Hang Dry – But At Least the McKenna Dream Won’t Die, No Sell-Out at Morgue $quare Garden; NYPD To Be Honored By Dolan (And Rightfully So), “PUCKGATE ’26!”, What’s Next & More at Blue Collar Blue Shirts (Thu Mar 19, 2026)
-
Rangers can’t stop Jack Hughes again, fall 6-3 to Devils: Takeaways at Forever Blueshirts (Thu Mar 19, 2026)
-
Rangers can’t stop Jack Hughes again, fall 6-3 to Devils: Takeaways at Forever Blueshirts (Thu Mar 19, 2026)
-
Rangers can’t stop Jack Hughes again, fall 6-3 to Devils: Takeaways at Forever Blueshirts (Thu Mar 19, 2026)
-
Devils Defeat Rangers, Bratt Hits 500 Point Milestone at Yahoo Sports NHL (Wed Mar 18, 2026)
-
Jack Hughes and Connor Brown lead the Devils past the Rangers, 6-3 at Yahoo Sports NHL (Wed Mar 18, 2026)
-
Jack Hughes Leads New Jersey Devils To 6-3 Win Over New York Rangers at All About the Jersey (Wed Mar 18, 2026)
-
Recap: Jack Hughes Haunts the Rangers Again in 6-3 Devils Win at Blue Shirt Banter (Wed Mar 18, 2026)
-
Hockey Hall of Fame delivers scathing rebuke to Jack Hughes on Golden Goal puck at Pucks and Pitchforks (Wed Mar 18, 2026)
-
Jack Hughes, Megan Keller pucks part of Hockey Hall of Fame's permanent collection at NBC Sports (Wed Mar 18, 2026)
-
HOF won't give puck to Hughes: Not his to own at ESPN (Wed Mar 18, 2026)
-
'Stop This Entitlement': Social Media Divided On Jack Hughes Wanting U.S. Golden Goal Puck at The Hockey News (Wed Mar 18, 2026)
-
USA Olympic hero Jack Hughes lost 'golden goal' puck. He wants it back. at Yahoo Sports NHL (Tue Mar 17, 2026)
-
Rondelle du but gagnant aux J.O. : Jack Hughes ne l’a pas, et il trouve que c’est de « la bullshit » at Dans Les Coulisses (Tue Mar 17, 2026)
Current Contract
Jack Hughes signed an $64,000,000 8-year contract with the New Jersey Devils and General Manager Tom Fitzgerald on November 30, 2021 with an AAV of $8,000,000. This contract will start in 2022-23 and end after the 2029-30 season. In the first season of the contract the cap hit was equivalent to 9.70% of the salary cap.
Standard Contract (RFA) ( ) (0 ratings)
Jack Hughes signed a $2,775,000 3-year contract with the New Jersey Devils and General Manager Ray Shero on July 12, 2019 with an AAV of $925,000. This contract will start in 2019-20 and end after the 2021-22 season. In the first season of the contract the cap hit was equivalent to 1.13% of the salary cap.
Entry Level Contract ( ) (0 ratings)
| Season | Age* | Clause | Cap Hit | AAV | Perf. Bonus | Sign. Bonus | Salary | Compensation | Minors Salary | Status | |
|---|---|---|---|---|---|---|---|---|---|---|---|
| 2019-20 | 18 | $925,000 | $3,775,000 | $2,850,000 | $92,500 | $832,500 | $925,000 | $70,000 | ELC | ||
| 2020-21 | 19 | $925,000 | $3,775,000 | $2,850,000 | $92,500 | $832,500 | $925,000 | $70,000 | ELC | ||
| 2021-22 | 20 | $925,000 | $3,775,000 | $2,850,000 | $92,500 | $832,500 | $925,000 | $70,000 | ELC | ||
| Total | $8,550,000 | $277,500 | $2,497,500 | $2,775,000 | $210,000 |
Career Statistics
| Regular Season | Playoffs | |||||||||||||||||||
|---|---|---|---|---|---|---|---|---|---|---|---|---|---|---|---|---|---|---|---|---|
| Season | League | Team | GP | G | A | Pts | +/- | PIM | Shots | Sh% | TOI/G | GP | G | A | Pts | +/- | PIM | Shots | Sh% | TOI/G |
| 2010-11 | Brick Invitational | Toronto Bulldogs | 6 | 4 | 7 | 11 | 6 | 2 | 2 | 2 | 2 | |||||||||
| 2016-17 | U16 AAA | Toronto Marlboros U16 AAA | 80 | 58 | 101 | 159 | 36 | |||||||||||||
| 2016-17 | GTHL U16 | Toronto Marlboros U16 AAA | 33 | 23 | 50 | 73 | 4 | |||||||||||||
| 2016-17 | OJHL | Georgetown Raiders | 9 | 1 | 2 | 3 | 2 | |||||||||||||
| 2017-18 | USDP | U.S. National U18 Team | 36 | 27 | 41 | 68 | 6 | |||||||||||||
| 2017-18 | USHL | USNTDP Juniors | 27 | 21 | 33 | 54 | +26 | 10 | ||||||||||||
| 2017-18 | USDP | U.S. National U17 Team | 24 | 13 | 35 | 48 | 10 | |||||||||||||
| 2017-18 | WJC-18 | USA U18 | 7 | 5 | 7 | 12 | +3 | 2 | ||||||||||||
| 2017-18 | WHC-17 | USA U17 | 6 | 5 | 10 | 15 | 2 | |||||||||||||
| 2018-19 | NTDP | U.S. National U18 Team | 50 | 34 | 78 | 112 | 28 | |||||||||||||
| 2018-19 | USHL | USNTDP Juniors | 24 | 12 | 36 | 48 | +17 | 4 | ||||||||||||
| 2018-19 | WJC-18 | USA U18 | 7 | 9 | 11 | 20 | +10 | 8 | ||||||||||||
| 2018-19 | WC | USA | 7 | 0 | 3 | 3 | +2 | |||||||||||||
| 2018-19 | WJC-20 | USA U20 | 4 | 0 | 4 | 4 | +2 | |||||||||||||
| 2019-20 | NHL | New Jersey Devils | 61 | 7 | 14 | 21 | -26 | 10 | 123 | 5.7 | 15:52 | |||||||||
| 2020-21 | NHL | New Jersey Devils | 56 | 11 | 20 | 31 | -3 | 16 | 142 | 7.7 | 19:04 | |||||||||
| 2021-22 | NHL | New Jersey Devils | 49 | 26 | 30 | 56 | -16 | 165 | 15.8 | 19:34 | ||||||||||
| 2022-23 | NHL | New Jersey Devils | 78 | 43 | 56 | 99 | +10 | 6 | 336 | 12.8 | 19:58 | 12 | 6 | 5 | 11 | -4 | 2 | 45 | 13.3 | 19:44 |
| 2023-24 | NHL | New Jersey Devils | 62 | 27 | 47 | 74 | -12 | 12 | 274 | 9.9 | 20:58 | |||||||||
| 2024-25 | NHL | New Jersey Devils | 62 | 27 | 43 | 70 | +12 | 18 | 229 | 11.8 | 20:54 | |||||||||
| 2024-25 | 4 Nations | United States | 4 | 0 | 1 | 1 | 11 | 0.0 | 17:54 | |||||||||||
| 2025-26 | NHL | New Jersey Devils | 61 | 27 | 50 | 77 | 10 | 228 | 11.8 | 21:19 | ||||||||||
| 2025-26 | OG | USA | 6 | 4 | 3 | 7 | +8 | 2 | 15 | 27.0 | 12:17 | |||||||||
| NHL Career | 429 | 168 | 260 | 428 | -35 | 72 | 1497 | 11.2 | 19:42 | 12 | 6 | 5 | 11 | -4 | 2 | 45 | 13.3 | 19:44 | ||