
 Cam York
| Position | Left Defense / Right Defense | Current Team | Philadelphia Flyers |
| Shoots | Left | Current Contract | 5 years ($5.2M CapHit) |
| Height | 6'0" | Expires | 2029-30 |
| Weight (lbs) | 194 | Expiry Age (Jun 30) | 29 |
| Age (DOB) | 25 (Jan 5, 2001) | Expiry Status | UFA |
| Drafted | 2019, Round 1, Overall 14 (PHI) |
| Date | Team | Transaction | |
|---|---|---|---|
| Oct 16, 2025 | Philadelphia Flyers | Activated from IR | |
| Oct 6, 2025 | Philadelphia Flyers | Placed on IR | |
| Jul 7, 2025 | Philadelphia Flyers | Signed 5 years @ $5.150M AAV starting in 2025-26 | |
| Nov 23, 2024 | Philadelphia Flyers | Activated from IR | |
| Oct 26, 2024 | Philadelphia Flyers | Placed on IR | |
| Jul 10, 2023 | Philadelphia Flyers | Signed 2 years @ $1.600M AAV starting in 2023-24 | |
| Apr 1, 2021 | Philadelphia Flyers | Signed to an entry level contract. |
Player Card(s)

URL: https://thestanleycap.com/cdn/player_cards/20252026/cam-york-8481546.png
URL: https://thestanleycap.com/cdn/player_cards/20242025/cam-york-8481546.png
URL: https://thestanleycap.com/cdn/player_cards/20232024/cam-york-8481546.png
About Player Cards
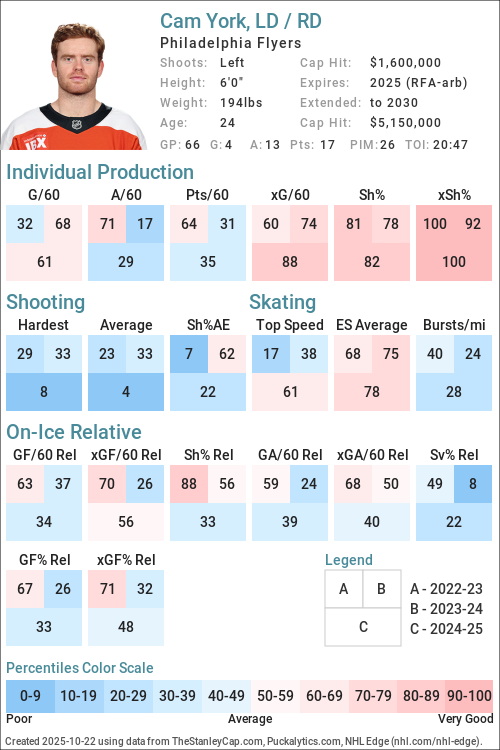
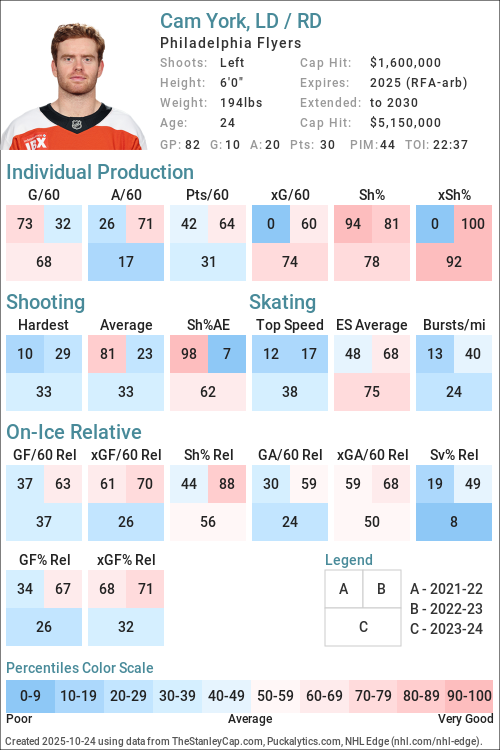
Player cards present an infographic of a players performance using a series of Player Archetypes developed for Puckalytics.com and TheStanleyCap.com. The boxes in the rink image show the archetype ratings for the season specified in the card while the graphs to the right show the five-year trends for those archetypes.
Except for Faceoffs, the values shown are the players z-score (standard deviation from the mean) for the specific metric used to calculate the archetype values. When calculating z-scores forwards were compared to forwards and defensemen were compared to defensemen. Positive values indicate the player is above average and shaded in blue, while negative values indicate the player is below average and shaded in pink. The five year trend charts show a range of -4.0 to 4.0.
The value shown for Faceoffs is the faceoff winning percentage rather than their z-score with winning percentages below 50 in pink shades and above 50 in blue shades.
All archetypes are 5v5 except 5v4 TOI, 4v5 TOI, Skating (even strength) and Faceoffs (all situations). Archetypes use regular season data only.
Archetypes Summary
- Sniper - Measures the to score above the expected goal rate.
- Rebound - Measures the percent of a players shot attempts that come from rebounds (forwards only).
- 5v4 TOI - Powerplay ice time, calculated as the percentage of his teams 5v4 ice time that the player was on the ice for.
- Shooter - Measures whether a players points come from shots (goals or assists on rebounds from his shots).
- Producer - Measures a players ability to produce goals and assists, adjusted for quality of teammates.
- Playmaker - Measures whether a players points come from passes.
- Drive - Measures a players ability to drive puck possession and generate shot attempts for his team.
- Rush - Measures the percent of a players shot attempts that come from rush plays
- Possession - An indicator of a players ability to improve his teams puck possession game.
- Faceoffs - Faceoff Winning Percentage (min. 75 faceoffs taken).
- 5v5 TOI - The percentage of his teams 5v5 TOI that the player was on the ice for.
- Suppress - Measures a players ability to suppress opponent puck possession and shot attempts against.
- Skating - An indicator of a players skating ability, or speed bursts above 20mph per mile skated.
- Defend - An indicator of a players ability to suppress shot quality against.
- 4v5 TOI - Penalty Kill ice time, calculated as the percentage of his teams 4v5 ice time that the player was on the ice for.
Data Sources
- Salary data is from TheStanleyCap.com
- Skating data is from NHL Edge
- Other statistics are from Puckalytics.com and derived from data from NHL.com
Terms of Use
You are free to use include player cards in written articles, share on social media, or on other public websites under the following conditions:
- You credit TheStanleyCap.com as the source and provide a link back to TheStanleyCap.com or this player page.
- You do not mass copy/duplicate/publish dozens or hundreds of player cards. A few, or a handful for a written article is fine. Be reasonable. Fair use rules apply.
- If you are a high-traffic website you must download and host the image(s) on your site rather than overload TheStanleyCap servers with traffic.
Note: Player cards will update daily throughout the season so if you want to include snapshot then you must download the image.
If you have any questions, send an e-mail to the e-mail address at the top of this page.
Read Introducing Player Archetypes on HockeyAnalysis.com for more details on archetype calculations.
Core Archetypes
| Season | Team(s) | GP | TOI | Producer | Playmaker | Shooter | Sniper | Rebound | Rush | Skating | Defend |
|---|---|---|---|---|---|---|---|---|---|---|---|
| 2020-21 | PHI | 3 | -1.63 | -1.40 | -0.83 | - | - | -0.81 | - | -0.66 | |
| 2021-22 | PHI | 30 | -0.30 | -0.82 | 0.53 | 2.24 | - | -1.07 | -1.04 | -0.80 | |
| 2022-23 | PHI | 54 | 0.14 | 0.45 | -0.47 | -1.37 | - | -0.89 | -0.48 | -0.03 | |
| 2023-24 | PHI | 82 | -0.58 | -1.04 | 0.45 | 0.51 | - | 0.36 | -0.77 | -1.34 | |
| 2024-25 | PHI | 66 | -0.49 | -0.50 | -0.29 | -0.73 | - | -0.68 | -0.64 | -0.74 | |
| 2025-26 | PHI | 74 | -0.57 | -0.29 | -0.69 | -0.86 | - | -0.70 | -0.71 | -0.65 |
Situational and Secondary Archetypes
| Season | Team(s) | GP | TOI | 5v5 TOI | 5v4 TOI | 4v5 TOI | Possession | Drive | Suppress | Faceoffs |
|---|---|---|---|---|---|---|---|---|---|---|
| 2020-21 | PHI | 3 | 0.07 | 0.45 | -2.32 | -6.39 | -3.92 | -5.17 | - | |
| 2021-22 | PHI | 30 | -0.70 | 0.61 | -1.38 | 0.87 | 0.21 | 1.30 | - | |
| 2022-23 | PHI | 54 | 0.11 | 0.37 | -1.63 | -0.24 | -0.88 | 0.65 | - | |
| 2023-24 | PHI | 82 | 0.63 | 0.23 | 0.72 | -0.66 | -1.22 | 0.26 | - | |
| 2024-25 | PHI | 66 | 0.63 | -1.34 | 0.70 | -0.52 | -0.15 | -0.64 | - | |
| 2025-26 | PHI | 74 | 0.41 | -0.02 | 1.14 | -0.36 | -0.86 | 0.54 | - |
5v5 Individual Stats
| Season | Team(s) | GP | TOI | G/60 | A/60 | Pts/60 | xG/60 | GAE/60 | Sh% | xSh% | Sh%AE | %SA Rush | %SA Reb. |
|---|---|---|---|---|---|---|---|---|---|---|---|---|---|
| 2020-21 | PHI | 3 | 48:21 | 0.00 | 0.00 | 0.00 | 0.06 | -0.06 | - | - | - | 0.00 | 0.00 |
| 2021-22 | PHI | 30 | 455:19 | 0.26 | 0.53 | 0.79 | 0.09 | 0.17 | 8.33 | 2.90 | 5.43 | 0.00 | 0.00 |
| 2022-23 | PHI | 54 | 895:33 | 0.13 | 0.80 | 0.94 | 0.21 | -0.07 | 6.45 | 10.01 | -3.56 | 0.00 | 6.35 |
| 2023-24 | PHI | 82 | 1395:35 | 0.26 | 0.47 | 0.73 | 0.19 | 0.06 | 6.67 | 5.03 | 1.64 | 1.45 | 4.35 |
| 2024-25 | PHI | 66 | 1176:04 | 0.20 | 0.51 | 0.71 | 0.26 | -0.05 | 6.56 | 8.28 | -1.72 | 0.00 | 3.74 |
| 2025-26 | PHI | 74 | 1250:59 | 0.14 | 0.62 | 0.77 | 0.20 | -0.06 | 5.66 | 7.97 | -2.31 | 0.00 | 6.59 |
5v5 On Ice Stats
| Season | Team(s) | GP | TOI | SAF/60 | GF/60 | xGF/60 | SAA/60 | GA/60 | xGA/60 | GF% | xGF% | xGF Rel | xGA Rel | xGF% Rel |
|---|---|---|---|---|---|---|---|---|---|---|---|---|---|---|
| 2020-21 | PHI | 3 | 48:21 | 35.99 | 1.24 | 1.72 | 52.12 | 2.48 | 3.31 | 33.33 | 34.17 | -0.56 | 1.38 | -19.98 |
| 2021-22 | PHI | 30 | 455:19 | 38.61 | 2.37 | 2.45 | 43.22 | 3.29 | 2.70 | 41.86 | 47.54 | 0.13 | -0.01 | 1.48 |
| 2022-23 | PHI | 54 | 895:33 | 38.66 | 2.55 | 2.66 | 40.33 | 2.55 | 2.53 | 50.00 | 51.24 | 0.20 | -0.15 | 3.41 |
| 2023-24 | PHI | 82 | 1395:35 | 42.09 | 2.41 | 2.40 | 37.83 | 3.01 | 2.24 | 44.44 | 51.74 | -0.17 | -0.01 | -1.58 |
| 2024-25 | PHI | 66 | 1176:04 | 39.54 | 2.24 | 2.57 | 39.08 | 2.86 | 2.08 | 44.00 | 55.28 | 0.11 | 0.05 | 0.53 |
| 2025-26 | PHI | 74 | 1250:59 | 33.96 | 2.54 | 2.26 | 36.60 | 2.40 | 2.22 | 51.46 | 50.39 | -0.25 | -0.12 | -1.36 |
NHL Edge Stats
| Skating | Shooting | Zone Time | |||||||||||
|---|---|---|---|---|---|---|---|---|---|---|---|---|---|
| Season | GP | Top Speed | Bursts>20/mi | Avg. Speed | Top Speed | Avg. Speed | %Long Range | %Mid Range | %High Danger | ES DZ% | ES NZ% | ES OZ% | |
| This table is for Basic and Premium subscribers only. To view please login to and/or subscribe to one of our subscription plans. | |||||||||||||
Legend
| Percentile 0-25 | Percentile 25-50 | Percentile 50-75 | Percentile 75-100 |
5v5 Defense Pairs
| Season | Teammate | Team | TOI | GF/60 | GA/60 | GF% | xGF/60 | xGA/60 | xGF% | xGF Rel | xGA Rel | xGF% Rel |
|---|
Glossary
| Type | Statistic | Definition |
|---|---|---|
| Individual | G/60 | Goals Against per 60 minutes. |
| Individual | A/60 | Assists per 60 minutes. |
| Individual | Pts/60 | Points per 60 minutes. |
| Individual | xG/60 | Expected Goals per 60 minutes. |
| Individual | GAE/60 | Goals Above Expected (G/60 - xG/60). |
| Individual | Sh% | Shooting Percentage. |
| Individual | xSh% | Expected Shooting Percentage. |
| Individual | Sh%AE | Shooting percentage above expected (Sh% - xSh%). |
| Individual | %SA Rush | Percentage of shot attempts determined to be on the rush. |
| Individual | %SA Reb. | Percentage of shot attempts determined to be from rebounds. |
| On Ice | SAF/60 | Shot Attempts For per 60 minutes. |
| On Ice | GF/60 | Goals For per 60 minutes. |
| On Ice | xGF/60 | Expected Goals For per 60 minutes. |
| On Ice | SAA/60 | Shot Attempts Against per 60 minutes (lower is better). |
| On Ice | GA/60 | Goals Against per 60 minutes (lower is better). |
| On Ice | xGA/60 | Expected Goals Against per 60 minutes (lower is better). |
| On Ice | GF% | Goals For Percentage = Goals For / (Goals For + Goals Against) |
| On Ice | xGF% | Expected Goals For Percentage = Expected Goals For / (Expected Goals For + Expected Goals Against) |
| On Ice | xGF Rel | xGF/60 when On Ice - xGF/60 when not On Ice. |
| On Ice | xGA Rel | xGA/60 when On Ice - xGA/60 when not On Ice (lower is better). |
| On Ice | xGF% Rel | xGF% when On Ice - xGF% when not On Ice. |
News and Opinions
-
Why a Flyers trade for Bowen Byram makes zero sense at Broad Street Hockey (Tue Jun 23, 2026)
-
2025-26 Player Grades: Cam York settled into his role at Broad Street Hockey (Mon Jun 22, 2026)
-
Ranking Danny Briere’s top 10 moves of the 2025-26 Flyers season at Broad Street Hockey (Thu Jun 11, 2026)
-
Flyers Report Cards: The Future of the Blueline? at Philly Hockey Now (Sat May 30, 2026)
-
Why The Flyers’ Biggest Offseason Need Might Still Be On Defense at Yahoo Sports NHL (Thu May 28, 2026)
-
Cam York is excited for next season, and he was happy to play with his best bud at Flyers Nitty Gritty (Tue May 19, 2026)
-
2025-2026 Philadelphia Flyers Exit Interviews at Flyer Nation (Thu May 14, 2026)
-
Flyers defensemen have fully bought in to Todd Reirden’s approach at Broad Street Hockey (Wed May 13, 2026)
-
Grading every Flyers player after brutal sweep by Hurricanes at Broad Street Hockey (Mon May 11, 2026)
-
Cam York has stepped up in a big way for the Flyers in the Playoffs at Flyers Nitty Gritty (Sat May 2, 2026)
-
Cam York threw his stick in the stands after scoring an OT winner, but the Flyers star got it back at Yahoo Sports NHL (Fri May 1, 2026)
-
Flyers Practice: Lines, York’s Stick Returned, & Getting Ready for Carolina at Philly Hockey Now (Fri May 1, 2026)
-
Dan Vladar was every Flyers fan after Game 6 winner at Pens Labyrinth (Fri May 1, 2026)
-
Trevor Zegras and Cam York rang the bell last night at the Sixers game at Flyers Nitty Gritty (Fri May 1, 2026)
-
Flyers’ Game 6 hero Cam York rings bell before 76ers’ Game 6 win at Broad Street Hockey (Fri May 1, 2026)
-
Flyers fans will love Penguins radio call of Cam York's OT goal at Broad Street Buzz (Thu Apr 30, 2026)
-
Grading every Flyer in the series win over the Penguins at Broad Street Hockey (Thu Apr 30, 2026)
-
Cam do! Flyers are sky high after York scores OT winner, launches stick into stands and beat Pens at Yahoo Sports NHL (Thu Apr 30, 2026)
-
Cam do! Flyers are sky high after York scores OT winner, launches stick into stands and beat Pens at NBC Sports (Thu Apr 30, 2026)
-
Game Breakdown: Vladar, York send Penguins home with 1-0 overtime victory at Flyers Nitty Gritty (Thu Apr 30, 2026)
-
Séries en bref : Une célébration digne d’un billet pour le 2e tour des séries at Dans Les Coulisses (Thu Apr 30, 2026)
-
Cam do! Flyers are sky high after York scores OT winner, launches stick into stands and beat Pens at Yahoo Sports NHL (Thu Apr 30, 2026)
-
Recap; 2026 ECQF Game 6: York’s goal, Vladař’s shutout send Flyers to second round at Flyer Nation (Thu Apr 30, 2026)
-
THEY DID IT! Flyers Eliminate Penguins in 6 Games at Flyers Nitty Gritty (Thu Apr 30, 2026)
-
Flyers’ Cam York went full rockstar to kill the Penguins’ dreams at Broad Street Hockey (Thu Apr 30, 2026)
-
Watch Cam York send Flyers to second round with OT goal vs. Penguins at Broad Street Buzz (Thu Apr 30, 2026)
-
Philadelphia Flyers eliminate Pittsburgh Penguins from playoffs after Cam York scores Game 6’s only goal in overtime at Russian Machine Never Breaks (Thu Apr 30, 2026)
-
Takeaways: Flyers clinch series in dramatic Game 6 behind Dan Vladar, Cam York at Broad Street Hockey (Thu Apr 30, 2026)
-
Cam York Calls Game: The Flyers Are Moving on After OT Thriller vs. Penguins at Philly Hockey Now (Wed Apr 29, 2026)
-
Connor McDavid, Nathan MacKinnon lead way-too-early 2026 fantasy hockey rankings at ESPN (Tue Apr 21, 2026)
-
Preview; Game 76/82: Philadelphia Flyers at New York Islanders at Flyer Nation (Fri Apr 3, 2026)
-
Flyers’ Cam York is having a confusing but effective season at Broad Street Hockey (Tue Mar 31, 2026)
-
Flyers GM Danny Briere must take a different approach with Zegras, Drysdale deals at Broad Street Hockey (Sat Mar 28, 2026)
-
Celebrini, Schafer and who else? Build your future with dynasty ranks at ESPN (Thu Mar 26, 2026)
-
Preview; Game 58/82: Philadelphia Flyers at New York Rangers at Flyer Nation (Thu Feb 26, 2026)
-
Cam York won a friendly wager for the US Men’s Team winning Gold at Flyers Nitty Gritty (Wed Feb 25, 2026)
-
Travis Sanheim and Cam York were bright spots on an uneven Flyers blue line before the break at Broad Street Buzz (Mon Feb 23, 2026)
-
Trevor Zegras reacts to Team USA’s thrilling win over Canada for Olympic gold at Broad Street Hockey (Mon Feb 23, 2026)
-
If the Flyers are rebuilding, why aren’t the kids playing? at Broad Street Hockey (Wed Feb 11, 2026)
-
Recap; Game 47/82: Philadelphia Flyers vs. New York Rangers at Flyer Nation (Sun Jan 18, 2026)
-
Preview; Game 47/82: Philadelphia Flyers vs. New York Rangers at Flyer Nation (Sat Jan 17, 2026)
-
Flyers’ Cam York speaks out on Cutter Gauthier and new Ducks rivalry at Broad Street Hockey (Thu Jan 8, 2026)
-
Takeaways: Zegras scores a pair, Flyers lose a pair to injury but defeat Anaheim 5-2 at Broad Street Hockey (Wed Jan 7, 2026)
-
Takeaways: Flyers open strong, then unravel in Buffalo at Broad Street Hockey (Fri Dec 19, 2025)
-
Takeaways: Flyers battle back to tie but once again lose in a shootout to Carolina 3-2 at Broad Street Hockey (Sun Dec 14, 2025)
-
York returns, but Flyers again fall to Hurricanes in shootout at Yahoo Sports NHL (Sun Dec 14, 2025)
-
Ty Murchison’s Future: Can the Flyers Learn from a Similar Situation? at Philly Hockey Now (Wed Dec 10, 2025)
-
Preview; Game 27/82: Philadelphia Flyers vs. Colorado Avalanche at Flyer Nation (Sun Dec 7, 2025)
-
Ty Murchison has been recalled, Cam York is a no go. Oliver Bonk makes his Professional Debut tonight at Flyers Nitty Gritty (Sat Dec 6, 2025)
-
Flyers’ Cam York officially out just day-to-day with injury at Broad Street Hockey (Thu Dec 4, 2025)
-
Cam York Injury Update at Flyers Nitty Gritty (Thu Dec 4, 2025)
-
3 players who could replace injured Cam York in Flyers lineup at Broad Street Hockey (Thu Dec 4, 2025)
-
Cam York injured in Flyers victory at Flyers Nitty Gritty (Thu Dec 4, 2025)
-
Flyers Explode in First, Score Five Goals En Route to Win vs. Sabres at Philly Hockey Now (Thu Dec 4, 2025)
-
Takeaways: Flyers’ offense returns in 5-2 victory over the Sabres at Broad Street Hockey (Thu Dec 4, 2025)
-
Flyers’ Cam York leaves game against Sabres with apparent injury at Broad Street Hockey (Thu Dec 4, 2025)
-
Flyers Defenseman Exits Game After Second Period Scuffle at Philly Hockey Now (Thu Dec 4, 2025)
-
Preview; Game 23/82: Philadelphia Flyers at New York Islanders at Flyer Nation (Fri Nov 28, 2025)
-
Flyers’ 3 Stars of the Week: Pair of young defensemen lead the way at Broad Street Hockey (Mon Nov 10, 2025)
-
Cam York is finally taking the next step for Flyers at Broad Street Hockey (Mon Nov 10, 2025)
-
Cam York is one of the keys to the Flyers' early success at Broad Street Buzz (Sat Nov 8, 2025)
-
Unheralded Flyers Defenseman Quietly Playing Like One of NHL's Best at Yahoo Sports NHL (Fri Nov 7, 2025)
-
Takeaways: Flyers soar, fall to earth, then get off the ground in 5-4 shootout victory over Canadiens at Broad Street Hockey (Wed Nov 5, 2025)
-
Which unit is the Flyers’ first power play unit? The answer is becoming quite clear. at Broad Street Hockey (Tue Nov 4, 2025)
-
10 takeaways from Flyers’ first 10 games of 2025-26 season at Broad Street Hockey (Fri Oct 31, 2025)
-
Jamie Drysdale and Cam York are good hockey players at Flyer Nation (Thu Oct 30, 2025)
-
Flyers Trick or Treat: Early surprises and letdowns this season at Broad Street Hockey (Tue Oct 28, 2025)
-
Flyers’ 3 Stars of the Week: Goaltending, Zegras remain the bright spots at Broad Street Hockey (Mon Oct 27, 2025)
-
Recap; Game 8/82: Philadelphia Flyers vs. New York Islanders at Flyer Nation (Sat Oct 25, 2025)
-
Preview; Game 8/82: Philadelphia Flyers vs. New York Islanders at Flyer Nation (Sat Oct 25, 2025)
-
Jamie Drysdale and Nick Seeler might be key to Flyers success next six weeks and beyond at Broad Street Hockey (Sat Oct 25, 2025)
-
Cam York starting Flyers season as one of NHL’s best defensemen at Broad Street Hockey (Thu Oct 23, 2025)
-
Cam York has played well since returning from injury at Flyers Nitty Gritty (Thu Oct 23, 2025)
-
Flyers Show Fight, Dominate Seattle in 5-2 Win Monday Night at Philly Hockey Now (Tue Oct 21, 2025)
-
Flyers Game 4, York’s Return; Lines, Notes, & How to Watch vs. Jets at Philly Hockey Now (Thu Oct 16, 2025)
-
Dressing York, Drysdale & Andrae: What If the Flyers Leaned Into Skill Instead of Size? at Yahoo Sports NHL (Wed Oct 15, 2025)
-
The Flyers have loaned Emil Andrae back to Lehigh, paving the way for Cam York’s return against the Winnipeg Jets at Flyers Nitty Gritty (Wed Oct 15, 2025)
-
Cam York's return spells doom for this Flyers' defenseman at Broad Street Buzz (Wed Oct 15, 2025)
-
Cam York could be set to make season debut against Jets at Broad Street Hockey (Wed Oct 15, 2025)
-
Cam York nearing return after taking part in Flyers morning skate at Broad Street Hockey (Mon Oct 13, 2025)
-
82 reasons to be hopeful for Flyers’ 2025-26 season at Broad Street Hockey (Wed Oct 8, 2025)
-
What are the Flyers options without Cam York? at Pens Labyrinth (Tue Oct 7, 2025)
-
Cam York is a big loss for the Flyers at Flyers Nitty Gritty (Tue Oct 7, 2025)
-
Flyers Opening Night Roster at Flyers Nitty Gritty (Mon Oct 6, 2025)
-
York Injured, Luchanko Rotating In, and More as Flyers Set Their Sights on Season Opener at Flyer Nation (Mon Oct 6, 2025)
-
Flyers’ Cam York sidelined day-to-day with a lower-body injury at Broad Street Hockey (Mon Oct 6, 2025)
-
Cam York Dealing With Lower-Body Issue at Philly Hockey Now (Mon Oct 6, 2025)
-
NHL season preview: Strengths, weaknesses, X factors for all 32 teams at ESPN (Mon Oct 6, 2025)
-
Raz’s 2025-26 Standings Predictions: Metropolitan Division at The Hockey Writers (Tue Sep 30, 2025)
-
Takeaways from the Flyers’ 5-1 Preseason Loss to the Capitals: York’s Return, Abols’ Case, and What Comes Next at Yahoo Sports NHL (Fri Sep 26, 2025)
-
Flyers Need Value on Their Contracts to Win the Stanley Cup at The Hockey Writers (Fri Sep 26, 2025)
-
Rick “Taco” Tocchet is using effective communication with a leader on the defensive side of the puck, Travis Sanheim at Flyers Nitty Gritty (Thu Sep 25, 2025)
-
Cam York continues to receive praise from Rick Tocchet, as he tries to become a leader at Flyers Nitty Gritty (Sun Sep 21, 2025)
-
Player Previews: Time for the young defense core to prove themselves at Broad Street Hockey (Sat Sep 20, 2025)
-
Rick Tocchet opens door for Cam York’s resurgence at Broad Street Hockey (Sat Sep 20, 2025)
-
Sean Couturier and Cam York are still firing digs at their old coach at Broad Street Buzz (Thu Sep 18, 2025)
-
Philadelphia Flyers 2025 Top 25 Under 25, No. 5: Cam York at Broad Street Hockey (Wed Sep 17, 2025)
-
Flyers’ Cam York Extension Reveals Long-Term Belief at The Hockey Writers (Sun Aug 31, 2025)
-
The Oasis song that best describes each Flyer at Broad Street Hockey (Fri Aug 29, 2025)
-
Cam York must prove the Flyers were right to believe in him at Broad Street Buzz (Fri Aug 29, 2025)
-
Cam York must prove the Flyers were right to believe in him at Pens Labyrinth (Fri Aug 29, 2025)
-
Will the Flyers Defense be Enough? at Philly Hockey Now (Fri Aug 8, 2025)
-
How Should We Judge Briere For the Flyers’ 2025 Offseason? at Brotherly Puck (Mon Jul 14, 2025)
-
Cam York’s Extension Caps Off Busy Offseason For Flyers at Flyer Nation (Sat Jul 12, 2025)
-
Cam York is more than worth the bargain at Broad Street Buzz (Mon Jul 7, 2025)
-
Is Cam York’s deal a good one for the Flyers? at Broad Street Buzz (Mon Jul 7, 2025)
-
Flyers sign Cam York to five-year, $25.75 million deal at Flyer Nation (Mon Jul 7, 2025)
-
With arbitration avoided, Flyers still face key decision on Cam York's contract at Broad Street Buzz (Sun Jul 6, 2025)
Current Contract
Cam York signed a $25,750,000 5-year contract with the Philadelphia Flyers and General Manager Daniel Briere on July 7, 2025 with an AAV of $5,150,000. This contract will start in 2025-26 and end after the 2029-30 season. In the first season of the contract the cap hit was equivalent to 5.39% of the salary cap.
Standard Contract (RFA) ( ) (0 ratings)
Cam York signed a $3,200,000 2-year contract with the Philadelphia Flyers and General Manager Daniel Briere on July 10, 2023 with an AAV of $1,600,000. This contract will start in 2023-24 and end after the 2024-25 season. In the first season of the contract the cap hit was equivalent to 1.92% of the salary cap.
Standard Contract (RFA) ( ) (0 ratings)
| Season | Age* | Clause | Cap Hit | AAV | Perf. Bonus | Sign. Bonus | Salary | Compensation | Minors Salary | Status | |
|---|---|---|---|---|---|---|---|---|---|---|---|
| 2023-24 | 22 | $1,600,000 | $1,600,000 | - | $300,000 | $1,300,000 | $1,600,000 | $1,600,000 | RFA | ||
| 2024-25 | 23 | $1,600,000 | $1,600,000 | - | - | $1,600,000 | $1,600,000 | $1,600,000 | RFA-arb | ||
| Total | - | $300,000 | $2,900,000 | $3,200,000 | $3,200,000 |
Cam York signed a $2,642,500 3-year contract with the Philadelphia Flyers and General Manager Chuck Fletcher on April 1, 2021 with an AAV of $880,833. This contract will start in 2020-21 and end after the 2022-23 season. In the first season of the contract the cap hit was equivalent to 1.08% of the salary cap.
Entry Level Contract ( ) (0 ratings)
| Season | Age* | Clause | Cap Hit | AAV | Perf. Bonus | Sign. Bonus | Salary | Compensation | Minors Salary | Status | |
|---|---|---|---|---|---|---|---|---|---|---|---|
| 2020-21 | 19 | $880,833 | $1,308,333 | $132,500 | $92,500 | $700,000 | $792,500 | $70,000 | ELC | ||
| 2021-22 | 20 | $880,833 | $1,308,333 | $425,000 | $92,500 | $832,500 | $925,000 | $70,000 | ELC | ||
| 2022-23 | 21 | $880,833 | $1,308,333 | $725,000 | $92,500 | $832,500 | $925,000 | $70,000 | ELC | ||
| Total | $1,282,500 | $277,500 | $2,365,000 | $2,642,500 | $210,000 |
Career Statistics
| Regular Season | Playoffs | |||||||||||||||||||
|---|---|---|---|---|---|---|---|---|---|---|---|---|---|---|---|---|---|---|---|---|
| Season | League | Team | GP | G | A | Pts | +/- | PIM | Shots | Sh% | TOI/G | GP | G | A | Pts | +/- | PIM | Shots | Sh% | TOI/G |
| 2013-14 | QC Int PW | Anaheim Jr. Ducks | 3 | 2 | 0 | 2 | ||||||||||||||
| 2013-14 | QC Int PW AAA | Anaheim Jr. Ducks | 3 | 2 | 2 | |||||||||||||||
| 2015-16 | 14U AAA | Shattuck St. Mary's 14U AAA | 60 | 18 | 51 | 69 | 15 | |||||||||||||
| 2016-17 | USHS-Prep | Shattuck St. Mary's 18U Prep | 54 | 9 | 39 | 48 | 6 | |||||||||||||
| 2016-17 | USA-S15 | Team Columbia | 3 | 2 | 1 | 3 | ||||||||||||||
| 2017-18 | USDP | U.S. National U17 Team | 38 | 5 | 20 | 25 | 12 | |||||||||||||
| 2017-18 | USHL | USNTDP Juniors | 33 | 3 | 11 | 14 | +13 | 12 | ||||||||||||
| 2017-18 | USDP | U.S. National U18 Team | 21 | 3 | 10 | 13 | 6 | |||||||||||||
| 2017-18 | WJC-18 | USA U18 | 7 | 0 | 6 | 6 | +6 | |||||||||||||
| 2017-18 | WHC-17 | USA U17 | 6 | 1 | 4 | 5 | 4 | |||||||||||||
| 2018-19 | NTDP | U.S. National U18 Team | 63 | 14 | 51 | 65 | 16 | |||||||||||||
| 2018-19 | USHL | USNTDP Juniors | 28 | 7 | 26 | 33 | +40 | 12 | ||||||||||||
| 2018-19 | WJC-18 | USA U18 | 7 | 4 | 7 | 11 | +13 | |||||||||||||
| 2019-20 | NCAA | Univ. of Michigan | 30 | 5 | 11 | 16 | +9 | 10 | ||||||||||||
| 2019-20 | WJC-20 | USA U20 | 5 | 0 | 0 | 0 | -1 | 2 | ||||||||||||
| 2020-21 | NCAA | Univ. of Michigan | 24 | 4 | 16 | 20 | +13 | 4 | ||||||||||||
| 2020-21 | AHL | Lehigh Valley Phantoms | 8 | 2 | 3 | 5 | -2 | 4 | ||||||||||||
| 2020-21 | WJC-20 | USA U20 | 7 | 1 | 5 | 6 | +4 | |||||||||||||
| 2020-21 | NHL | Philadelphia Flyers | 3 | 0 | 0 | 0 | -1 | 1 | 0.0 | 19:47 | ||||||||||
| 2021-22 | AHL | Lehigh Valley Phantoms | 34 | 2 | 10 | 12 | -8 | 12 | ||||||||||||
| 2021-22 | NHL | Philadelphia Flyers | 30 | 3 | 7 | 10 | -14 | 6 | 33 | 9.1 | 19:05 | |||||||||
| 2022-23 | NHL | Philadelphia Flyers | 54 | 2 | 18 | 20 | -1 | 18 | 42 | 4.8 | 19:39 | |||||||||
| 2022-23 | AHL | Lehigh Valley Phantoms | 20 | 3 | 10 | 13 | -1 | 4 | ||||||||||||
| 2023-24 | NHL | Philadelphia Flyers | 82 | 10 | 20 | 30 | -13 | 44 | 134 | 7.5 | 22:37 | |||||||||
| 2024-25 | NHL | Philadelphia Flyers | 66 | 4 | 13 | 17 | -8 | 26 | 65 | 6.2 | 20:47 | |||||||||
| 2025-26 | NHL | Philadelphia Flyers | 74 | 4 | 22 | 26 | +5 | 28 | 89 | 4.5 | 22:32 | 10 | 1 | 1 | 2 | +1 | 6 | 18 | 5.6 | 23:22 |
| NHL Career | 309 | 23 | 80 | 103 | -32 | 122 | 364 | 6.3 | 21:19 | 10 | 1 | 1 | 2 | +1 | 6 | 18 | 5.6 | 23:22 | ||