
 Blake Coleman
| Position | Right Wing / Left Wing | Current Team | Minnesota Wild |
| Shoots | Left | Current Contract | 6 years ($4.9M CapHit) |
| Height | 5'11" | Expires | 2026-27 |
| Weight (lbs) | 199 | Expiry Age (Jun 30) | 35 |
| Age (DOB) | 34 (Nov 28, 1991) | Expiry Status | UFA |
| Drafted | 2011, Round 3, Overall 75 (NJD) |
| Date | Team | Transaction | |
|---|---|---|---|
| Jul 2, 2026 | Minnesota Wild | Acquired from Calgary Flames | |
| Jul 2, 2026 | Calgary Flames | Traded to Minnesota Wild | |
| Feb 20, 2026 | Calgary Flames | Activated from IR | |
| Jan 13, 2026 | Calgary Flames | Placed on IR | |
| Jul 28, 2021 | Calgary Flames | Signed 6 years @ $4.900M AAV starting in 2021-22 | |
| Jul 17, 2018 | New Jersey Devils | Signed 3 years @ $1.800M AAV starting in 2018-19 | |
| Jul 26, 2017 | New Jersey Devils | Signed 1 year @ $660K AAV starting in 2017-18 | |
| Jul 1, 2015 | New Jersey Devils | Signed to an entry level contract. |
Player Card(s)
URL: https://thestanleycap.com/cdn/player_cards/20252026/blake-coleman-8476399.png

URL: https://thestanleycap.com/cdn/player_cards/20242025/blake-coleman-8476399.png

URL: https://thestanleycap.com/cdn/player_cards/20232024/blake-coleman-8476399.png
About Player Cards
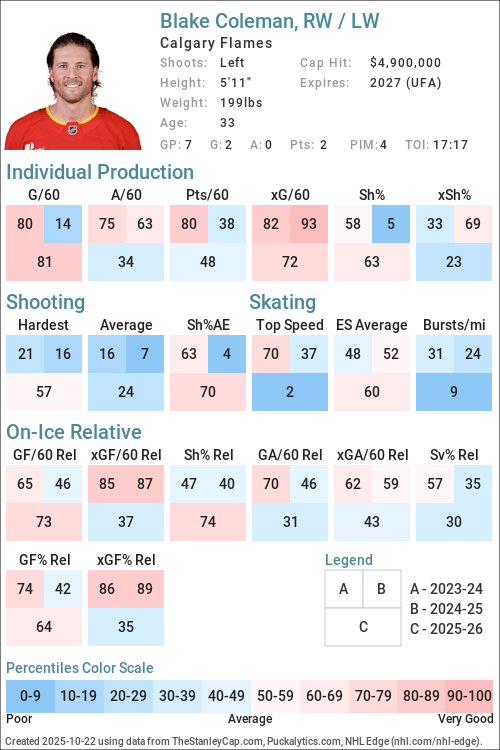
Player cards present an infographic of a players performance using a series of Player Archetypes developed for Puckalytics.com and TheStanleyCap.com. The boxes in the rink image show the archetype ratings for the season specified in the card while the graphs to the right show the five-year trends for those archetypes.
Except for Faceoffs, the values shown are the players z-score (standard deviation from the mean) for the specific metric used to calculate the archetype values. When calculating z-scores forwards were compared to forwards and defensemen were compared to defensemen. Positive values indicate the player is above average and shaded in blue, while negative values indicate the player is below average and shaded in pink. The five year trend charts show a range of -4.0 to 4.0.
The value shown for Faceoffs is the faceoff winning percentage rather than their z-score with winning percentages below 50 in pink shades and above 50 in blue shades.
All archetypes are 5v5 except 5v4 TOI, 4v5 TOI, Skating (even strength) and Faceoffs (all situations). Archetypes use regular season data only.
Archetypes Summary
- Sniper - Measures the to score above the expected goal rate.
- Rebound - Measures the percent of a players shot attempts that come from rebounds (forwards only).
- 5v4 TOI - Powerplay ice time, calculated as the percentage of his teams 5v4 ice time that the player was on the ice for.
- Shooter - Measures whether a players points come from shots (goals or assists on rebounds from his shots).
- Producer - Measures a players ability to produce goals and assists, adjusted for quality of teammates.
- Playmaker - Measures whether a players points come from passes.
- Drive - Measures a players ability to drive puck possession and generate shot attempts for his team.
- Rush - Measures the percent of a players shot attempts that come from rush plays
- Possession - An indicator of a players ability to improve his teams puck possession game.
- Faceoffs - Faceoff Winning Percentage (min. 75 faceoffs taken).
- 5v5 TOI - The percentage of his teams 5v5 TOI that the player was on the ice for.
- Suppress - Measures a players ability to suppress opponent puck possession and shot attempts against.
- Skating - An indicator of a players skating ability, or speed bursts above 20mph per mile skated.
- Defend - An indicator of a players ability to suppress shot quality against.
- 4v5 TOI - Penalty Kill ice time, calculated as the percentage of his teams 4v5 ice time that the player was on the ice for.
Data Sources
- Salary data is from TheStanleyCap.com
- Skating data is from NHL Edge
- Other statistics are from Puckalytics.com and derived from data from NHL.com
Terms of Use
You are free to use include player cards in written articles, share on social media, or on other public websites under the following conditions:
- You credit TheStanleyCap.com as the source and provide a link back to TheStanleyCap.com or this player page.
- You do not mass copy/duplicate/publish dozens or hundreds of player cards. A few, or a handful for a written article is fine. Be reasonable. Fair use rules apply.
- If you are a high-traffic website you must download and host the image(s) on your site rather than overload TheStanleyCap servers with traffic.
Note: Player cards will update daily throughout the season so if you want to include snapshot then you must download the image.
If you have any questions, send an e-mail to the e-mail address at the top of this page.
Read Introducing Player Archetypes on HockeyAnalysis.com for more details on archetype calculations.
Core Archetypes
| Season | Team(s) | GP | TOI | Producer | Playmaker | Shooter | Sniper | Rebound | Rush | Skating | Defend |
|---|---|---|---|---|---|---|---|---|---|---|---|
| 2016-17 | NJD | 23 | -1.57 | -1.07 | -0.97 | -1.47 | -0.95 | -1.95 | - | -1.01 | |
| 2017-18 | NJD | 79 | -0.57 | -0.63 | -0.21 | -0.42 | -0.35 | 1.30 | - | -0.09 | |
| 2018-19 | NJD | 78 | -0.54 | -0.91 | 0.17 | -0.48 | -0.70 | -0.02 | - | -1.78 | |
| 2019-20 | NJD, TBL | 66 | -0.00 | -1.21 | 1.83 | 0.23 | -0.76 | 0.72 | - | -0.67 | |
| 2020-21 | TBL | 55 | 1.01 | 0.61 | 0.44 | 0.25 | -1.12 | -0.10 | - | -0.63 | |
| 2021-22 | CGY | 81 | 0.30 | -0.37 | 0.74 | -0.32 | -0.01 | -1.00 | -0.19 | -0.01 | |
| 2022-23 | CGY | 82 | 0.29 | 0.07 | 0.03 | -1.01 | 0.37 | -0.79 | -0.38 | 1.09 | |
| 2023-24 | CGY | 78 | 1.09 | 0.69 | 0.61 | 0.43 | 0.50 | -0.25 | -0.60 | 0.15 | |
| 2024-25 | CGY | 82 | -0.23 | 0.65 | -0.94 | -1.45 | -0.39 | -0.71 | -0.76 | -0.35 | |
| 2025-26 | CGY | 69 | 0.40 | -0.71 | 1.42 | 0.44 | -0.84 | 0.05 | -0.48 | 0.16 |
Situational and Secondary Archetypes
| Season | Team(s) | GP | TOI | 5v5 TOI | 5v4 TOI | 4v5 TOI | Possession | Drive | Suppress | Faceoffs |
|---|---|---|---|---|---|---|---|---|---|---|
| 2016-17 | NJD | 23 | -0.26 | -2.03 | -0.60 | -0.95 | -1.45 | 0.60 | 42.5 | |
| 2017-18 | NJD | 79 | -0.19 | -2.03 | 1.17 | 0.74 | -0.37 | 1.92 | 46.9 | |
| 2018-19 | NJD | 78 | 0.56 | -1.31 | 1.65 | 0.62 | 0.58 | 0.15 | 41.6 | |
| 2019-20 | NJD, TBL | 66 | 0.68 | -1.70 | 1.44 | 1.05 | 0.59 | 1.07 | 31.5 | |
| 2020-21 | TBL | 55 | 0.21 | -1.74 | 0.91 | 1.62 | 1.52 | 0.95 | - | |
| 2021-22 | CGY | 81 | 0.21 | -1.65 | 0.12 | 0.99 | 0.18 | 1.50 | - | |
| 2022-23 | CGY | 82 | 0.80 | -1.81 | 0.05 | 1.05 | 0.86 | 0.64 | - | |
| 2023-24 | CGY | 78 | 1.02 | -0.99 | 0.34 | 1.11 | 1.04 | 0.47 | - | |
| 2024-25 | CGY | 82 | 0.78 | -0.53 | 1.13 | 1.10 | 0.69 | 0.87 | 48.1 | |
| 2025-26 | CGY | 69 | 0.53 | -0.61 | 1.24 | 1.17 | 0.47 | 1.20 | - |
5v5 Individual Stats
| Season | Team(s) | GP | TOI | G/60 | A/60 | Pts/60 | xG/60 | GAE/60 | Sh% | xSh% | Sh%AE | %SA Rush | %SA Reb. |
|---|---|---|---|---|---|---|---|---|---|---|---|---|---|
| 2016-17 | NJD | 23 | 263:12 | 0.23 | 0.23 | 0.46 | 0.54 | -0.31 | 3.85 | 9.16 | -5.31 | 0.00 | 2.94 |
| 2017-18 | NJD | 79 | 919:50 | 0.65 | 0.72 | 1.37 | 0.77 | -0.12 | 8.13 | 9.57 | -1.44 | 6.55 | 4.17 |
| 2018-19 | NJD | 78 | 1008:13 | 0.71 | 0.71 | 1.43 | 0.90 | -0.18 | 7.06 | 8.86 | -1.80 | 4.05 | 3.60 |
| 2019-20 | TBL | 9 | 103:54 | 0.00 | 0.58 | 0.58 | 0.98 | -0.98 | 0.00 | 12.08 | -12.08 | 5.00 | 10.00 |
| 2019-20 | NJD | 57 | 732:26 | 1.31 | 0.57 | 1.88 | 1.08 | 0.23 | 10.88 | 8.96 | 1.92 | 5.43 | 3.26 |
| 2019-20 | NJD, TBL | 66 | 836:20 | 1.15 | 0.57 | 1.72 | 1.07 | 0.08 | 9.94 | 9.23 | 0.70 | 5.39 | 3.92 |
| 2020-21 | TBL | 55 | 657:55 | 0.82 | 1.28 | 2.10 | 0.72 | 0.10 | 10.00 | 8.83 | 1.17 | 3.51 | 2.63 |
| 2021-22 | CGY | 81 | 1016:04 | 0.89 | 0.89 | 1.77 | 1.03 | -0.14 | 7.61 | 8.83 | -1.21 | 2.05 | 6.15 |
| 2022-23 | CGY | 82 | 1097:36 | 0.66 | 1.09 | 1.75 | 1.03 | -0.37 | 7.45 | 11.68 | -4.23 | 2.21 | 8.41 |
| 2023-24 | CGY | 78 | 1084:56 | 0.94 | 1.16 | 2.10 | 0.79 | 0.15 | 10.76 | 9.07 | 1.69 | 3.35 | 9.57 |
| 2024-25 | CGY | 82 | 1122:27 | 0.37 | 1.02 | 1.39 | 0.80 | -0.43 | 4.83 | 10.37 | -5.54 | 1.35 | 6.28 |
| 2025-26 | CGY | 69 | 904:29 | 1.06 | 0.80 | 1.86 | 0.95 | 0.11 | 11.51 | 10.35 | 1.16 | 2.72 | 5.43 |
5v5 On Ice Stats
| Season | Team(s) | GP | TOI | SAF/60 | GF/60 | xGF/60 | SAA/60 | GA/60 | xGA/60 | GF% | xGF% | xGF Rel | xGA Rel | xGF% Rel |
|---|---|---|---|---|---|---|---|---|---|---|---|---|---|---|
| 2016-17 | NJD | 23 | 263:12 | 32.83 | 0.68 | 1.76 | 37.84 | 2.28 | 2.11 | 23.08 | 45.39 | -0.57 | -0.20 | -4.69 |
| 2017-18 | NJD | 79 | 919:50 | 40.51 | 2.28 | 2.23 | 39.40 | 2.22 | 1.97 | 50.72 | 53.03 | -0.19 | -0.53 | 3.92 |
| 2018-19 | NJD | 78 | 1008:13 | 42.55 | 2.38 | 2.55 | 43.68 | 3.27 | 2.66 | 42.11 | 48.94 | 0.11 | 0.15 | -0.32 |
| 2019-20 | TBL | 9 | 103:54 | 36.96 | 2.31 | 1.99 | 42.16 | 1.73 | 2.16 | 57.14 | 48.05 | -0.42 | -0.18 | -2.72 |
| 2019-20 | NJD | 57 | 732:26 | 43.25 | 2.79 | 2.41 | 41.70 | 3.19 | 2.39 | 46.58 | 50.22 | 0.04 | -0.44 | 4.63 |
| 2019-20 | NJD, TBL | 66 | 836:20 | 42.47 | 2.73 | 2.36 | 41.75 | 3.01 | 2.36 | 47.50 | 49.98 | -0.02 | -0.40 | 3.73 |
| 2020-21 | TBL | 55 | 657:55 | 45.78 | 2.74 | 2.64 | 34.93 | 2.28 | 2.17 | 54.55 | 54.92 | 0.28 | -0.08 | 3.67 |
| 2021-22 | CGY | 81 | 1016:04 | 49.07 | 2.42 | 2.97 | 35.61 | 1.83 | 2.20 | 56.94 | 57.45 | 0.05 | -0.17 | 2.31 |
| 2022-23 | CGY | 82 | 1097:36 | 51.88 | 2.41 | 3.23 | 35.53 | 2.13 | 2.28 | 53.01 | 58.59 | 0.37 | -0.20 | 5.14 |
| 2023-24 | CGY | 78 | 1084:56 | 47.67 | 2.77 | 2.65 | 39.71 | 2.49 | 2.43 | 52.63 | 52.14 | 0.35 | 0.01 | 3.43 |
| 2024-25 | CGY | 82 | 1122:27 | 45.38 | 2.03 | 2.49 | 38.17 | 2.08 | 2.34 | 49.35 | 51.56 | 0.32 | 0.00 | 3.44 |
| 2025-26 | CGY | 69 | 904:29 | 41.66 | 2.72 | 2.45 | 38.74 | 2.45 | 2.35 | 52.56 | 50.98 | 0.10 | -0.54 | 6.11 |
NHL Edge Stats
| Skating | Shooting | Zone Time | |||||||||||
|---|---|---|---|---|---|---|---|---|---|---|---|---|---|
| Season | GP | Top Speed | Bursts>20/mi | Avg. Speed | Top Speed | Avg. Speed | %Long Range | %Mid Range | %High Danger | ES DZ% | ES NZ% | ES OZ% | |
| This table is for Basic and Premium subscribers only. To view please login to and/or subscribe to one of our subscription plans. | |||||||||||||
Legend
| Percentile 0-25 | Percentile 25-50 | Percentile 50-75 | Percentile 75-100 |
5v5 Lines
| Season | Teammate | Teammate | Team | TOI | GF/60 | GA/60 | GF% | xGF/60 | xGA/60 | xGF% | xGF Rel | xGA Rel | xGF% Rel |
|---|
Glossary
| Type | Statistic | Definition |
|---|---|---|
| Individual | G/60 | Goals Against per 60 minutes. |
| Individual | A/60 | Assists per 60 minutes. |
| Individual | Pts/60 | Points per 60 minutes. |
| Individual | xG/60 | Expected Goals per 60 minutes. |
| Individual | GAE/60 | Goals Above Expected (G/60 - xG/60). |
| Individual | Sh% | Shooting Percentage. |
| Individual | xSh% | Expected Shooting Percentage. |
| Individual | Sh%AE | Shooting percentage above expected (Sh% - xSh%). |
| Individual | %SA Rush | Percentage of shot attempts determined to be on the rush. |
| Individual | %SA Reb. | Percentage of shot attempts determined to be from rebounds. |
| On Ice | SAF/60 | Shot Attempts For per 60 minutes. |
| On Ice | GF/60 | Goals For per 60 minutes. |
| On Ice | xGF/60 | Expected Goals For per 60 minutes. |
| On Ice | SAA/60 | Shot Attempts Against per 60 minutes (lower is better). |
| On Ice | GA/60 | Goals Against per 60 minutes (lower is better). |
| On Ice | xGA/60 | Expected Goals Against per 60 minutes (lower is better). |
| On Ice | GF% | Goals For Percentage = Goals For / (Goals For + Goals Against) |
| On Ice | xGF% | Expected Goals For Percentage = Expected Goals For / (Expected Goals For + Expected Goals Against) |
| On Ice | xGF Rel | xGF/60 when On Ice - xGF/60 when not On Ice. |
| On Ice | xGA Rel | xGA/60 when On Ice - xGA/60 when not On Ice (lower is better). |
| On Ice | xGF% Rel | xGF% when On Ice - xGF% when not On Ice. |
News and Opinions
-
Where Does Blake Coleman Fit Into the Wild Lineup? at Hockey Wilderness (Fri Jul 24, 2026)
-
Wild trading for Blake Coleman just got unexpectedly even better at Gone Puck Wild (Mon Jul 13, 2026)
-
Trading For Coleman and Maatta Gives the Wild More Bite at Hockey Wilderness (Tue Jul 7, 2026)
-
Recapping the Minnesota Wild’s Early Free Agency Moves at The Hockey Writers (Fri Jul 3, 2026)
-
Flames fans react to the Blake Coleman trade at Flames Nation (Fri Jul 3, 2026)
-
6 thoughts on the Calgary Flames’ Blake Coleman trade at Flames Nation (Thu Jul 2, 2026)
-
Wild Get Two Upgrades For the Price of One In Blake Coleman Deal at Hockey Wilderness (Thu Jul 2, 2026)
-
Grade the Trade: Calgary Flames' Blake Coleman Dealt to the Minnesota Wild at Flame for Thought (Thu Jul 2, 2026)
-
Flames general manager Craig Conroy breaks down the Blake Coleman trade at Flames Nation (Thu Jul 2, 2026)
-
Wild make their first trade of the offseason, but it's not for Dylan Larkin at Gone Puck Wild (Thu Jul 2, 2026)
-
NHL Trade: The Minnesota Wild Get Blake Coleman and Olli Maatta from the Calgary Flames at NHL Rumors (Thu Jul 2, 2026)
-
Wild Acquire Blake Coleman, Olli Maatta From Calgary at Yahoo Sports NHL (Thu Jul 2, 2026)
-
Flames Trade Blake Coleman and Olli Määttä to Wild for Jake Middleton at The Hockey Writers (Thu Jul 2, 2026)
-
Breaking: Calgary Flames trade Blake Coleman, Olli Määttä to Wild for Jacob Middleton, draft picks at The Win Column (Thu Jul 2, 2026)
-
Flames trade Coleman and Maatta to Wild for Jake Middleton and draft picks at Flames Nation (Thu Jul 2, 2026)
-
Calgary Flames Officially Trade Veteran Blake Coleman at Flame for Thought (Thu Jul 2, 2026)
-
Flames’ Blake Coleman Trade Market Goes Quiet Amid Limited Interest at The Hockey Writers (Sun Jun 28, 2026)
-
NHL Rumors: Connor Zary, Blake Coleman, Quinn Hughes, Rasmus Ristolainen, and Bowen Byram at NHL Rumors (Fri Jun 26, 2026)
-
‘Trade market quiet for the moment’ for Flames forward Blake Coleman: LeBrun at Flames Nation (Wed Jun 24, 2026)
-
NHL Insider Provides the Latest on the Future of Blake Coleman With the Calgary Flames at Flame for Thought (Wed Jun 24, 2026)
-
NHL Rumors: Calgary Flames Want to Add Young NHL Players at NHL Rumors (Sat Jun 20, 2026)
-
The Flames are keeping their Blake Coleman options open: LeBrun at Flames Nation (Wed Jun 17, 2026)
-
NHL Insider Reveals What the Calgary Flames are Looking for in a Blake Coleman Trade at Flame for Thought (Tue Jun 16, 2026)
-
Coleman Remains Only Flames Player on The Athletic's NHL Trade Board at Yahoo Sports NHL (Wed Jun 10, 2026)
-
FN Report Cards: Blake Coleman was a standout in a challenging Flames season at Flames Nation (Mon Jun 8, 2026)
-
Five Potential Trade Partners for Calgary Flames Forward Blake Coleman at Flame for Thought (Sat Jun 6, 2026)
-
Which Former Flames Are Playing in the Stanley Cup Final? at Yahoo Sports NHL (Thu Jun 4, 2026)
-
Could Joel Farabee fill Blake Coleman’s shoes with the Flames? at Flames Nation (Sun May 10, 2026)
-
Blake Coleman’s future with the Flames may depend on the draft lottery at Flames Nation (Sat Apr 25, 2026)
-
4 Offseason Trade Destinations for Flames Forward Blake Coleman at The Hockey Writers (Fri Apr 24, 2026)
-
Is the offseason the best time to trade Blake Coleman? at The Win Column (Wed Apr 22, 2026)
-
5 Flames who aren’t likely to return next season at Flames Nation (Tue Apr 21, 2026)
-
The Flames’ penalty killing was quietly quite good in 2025-26 at Flames Nation (Mon Apr 20, 2026)
-
Kings vs Flames Prediction, Picks & Odds for Tonight’s NHL Game at Yahoo Sports NHL (Thu Apr 16, 2026)
-
Blake Coleman named 2025-26 Peter Maher Good Guy Award winner at Flames Nation (Tue Apr 14, 2026)
-
Blake Coleman Honoured With Massive Calgary Flames End Of Season Award at Flame for Thought (Tue Apr 14, 2026)
-
Brayden Pachal has 3 points as the Flames beat the Mammoth 4-1 at Yahoo Sports NHL (Mon Apr 13, 2026)
-
3 Flames to Sell High on This Offseason at The Hockey Writers (Sun Apr 12, 2026)
-
Golden Knights Overcome Delay, Extinguish Flames in Much-Needed 6-3 Win at Yahoo Sports NHL (Fri Apr 3, 2026)
-
Pickups: Blake Coleman, Troy Terry and other matchup-based weekly adds at ESPN (Mon Mar 16, 2026)
-
Flames Make Bold Deadline Moves, Position Franchise for Accelerated Rebuild at The Hockey Writers (Sat Mar 7, 2026)
-
Flames trade rumours: Offers ‘not enough enough’ for Blake Coleman, lots of interest in Zach Whitecloud at Flames Nation (Thu Mar 5, 2026)
-
Flames News & Rumours: Kadri, Coleman, Lomberg at The Hockey Writers (Wed Mar 4, 2026)
-
NHL Rumor Roundup: Latest On Blues' Robert Thomas And Jordan Kyrou, Flames' Blake Coleman And Devils' Simon Nemec at The Hockey News (Wed Mar 4, 2026)
-
Taking Stock of the Flames’ Assets as the Trade Deadline Approaches at The Hockey Writers (Wed Mar 4, 2026)
-
Stars' final game before the deadline may have been Coleman's swan song in Calgary at Blackout Dallas (Wed Mar 4, 2026)
-
NHL Rumors: How Active Will the Calgary Flames Be? at NHL Rumors (Tue Mar 3, 2026)
-
The Flames’ likely trade chips ranked by potential return ahead of the NHL Trade Deadline at Flames Nation (Tue Mar 3, 2026)
-
Flames Week Ahead: Schedule & Storylines – Trade Deadline, Weegar, Coleman, Kadri and More at The Hockey Writers (Sun Mar 1, 2026)
-
Ranking the Calgary Flames Most Likely to Be Dealt by the Trade Deadline at The Hockey Writers (Sat Feb 28, 2026)
-
Flames forwards Blake Coleman, Nazem Kadri and Ryan Lomberg headline new Daily Faceoff trade board at Flames Nation (Fri Feb 27, 2026)
-
The writing is on the wall for a Blake Coleman trade at The Win Column (Thu Feb 26, 2026)
-
Flames News & Rumours: Kadri, Coleman, Pospisil & More at The Hockey Writers (Thu Feb 26, 2026)
-
Dallas fans' No. 1 trade target may be playing against the Stars on deadline day at Blackout Dallas (Wed Feb 25, 2026)
-
Projecting the Calgary Flames’ forward lines for their first game after the Olympic break against the San Jose Sharks at The Win Column (Mon Feb 23, 2026)
-
NHL Trade Deadline 2026: Trade Freeze Lifted, Deadline Approaching — Avalanche Trade Board 2.0 at Colorado Hockey Now (Mon Feb 23, 2026)
-
NHL Trade Deadline 2026: Trade Freeze Lifted, Deadline Approaching — Avalanche Trade Board 2.0 at Colorado Hockey Now (Mon Feb 23, 2026)
-
Flames Week Ahead: Schedule & Storylines – Huberdeau Surgery, Coleman Watch and More at The Hockey Writers (Sun Feb 22, 2026)
-
Calgary Flames trade candidate is a perfect Buffalo Sabres NHL deadline target at Sabres Noise (Sat Feb 21, 2026)
-
Flames roster news: Blake Coleman and John Beecher activated from injury reserve list at Flames Nation (Fri Feb 20, 2026)
-
Un indice alimente les rumeurs sur la destination de Blake Coleman at HABSolument Fan (Thu Feb 19, 2026)
-
NHL Rumors: Coleman on Trade, Devils, Senators, Penguins, and Oilers Talk at The Hockey Writers (Thu Feb 19, 2026)
-
Could the Flames get a first-round pick for Blake Coleman? at Flames Nation (Wed Feb 11, 2026)
-
Le Canadien forcé de faire une croix sur Blake Coleman? at HABSolument Fan (Wed Feb 11, 2026)
-
Coin des rumeurs : Une prolongation de contrat à venir pour Quinn Hughes? at Dans Les Coulisses (Mon Feb 9, 2026)
-
NHL Trade Deadline 2026: Avalanche Trade Board at Colorado Hockey Now (Thu Jan 15, 2026)
-
Blake Coleman à Montréal : Elliotte Friedman jette une douche d’eau froide sur les rumeurs at Dans Les Coulisses (Wed Jan 14, 2026)
-
Flames News & Rumors: Andersson, Kadri, Coleman & More at The Hockey Writers (Wed Jan 14, 2026)
-
NHL Rumors: Calgary Flames and Tampa Bay Lightning at NHL Rumors (Tue Jan 13, 2026)
-
Flames place forward Blake Coleman on injury reserve list at Flames Nation (Tue Jan 13, 2026)
-
NHL Rumor Roundup: The Latest On Elias Pettersson, Jesperi Kotkaniemi, Nazem Kadri And Blake Coleman at The Hockey News (Tue Jan 13, 2026)
-
Canadiens Should Pursue Blake Coleman in a Trade at The Hockey Writers (Tue Jan 13, 2026)
-
Blake Coleman is on pace to be the lowest leading goal scorer in a full season in the Calgary Flames’ history at The Win Column (Mon Jan 12, 2026)
-
32 Thoughts: Flames hoping to move Andersson before the Olympics, Detroit rumours dismissed, while Blake Coleman is happy in Calgary at The Win Column (Mon Jan 12, 2026)
-
NHL Rumors: What Are the Calgary Flames Looking to get for Blake Coleman and Rasmus Andersson at NHL Rumors (Sun Jan 11, 2026)
-
Flames injury news: Blake Coleman out day-to-day with upper body injury at Flames Nation (Sat Jan 10, 2026)
-
Report: Nazem Kadri open to opportunities with a top contender, Montreal Canadiens eyeing Blake Coleman at The Win Column (Fri Jan 9, 2026)
-
NHL Rumor Mill – January 9, 2026 at Spectors Hockey (Fri Jan 9, 2026)
-
Flames trade rumours: Blake Coleman at top of Canadiens wish list at Flames Nation (Thu Jan 8, 2026)
-
NHL Rumors: The Montreal Canadiens Looking for a Physical, Scoring Middle-Six Forward at NHL Rumors (Thu Jan 8, 2026)
-
NHL insider believes Blake Coleman is the top trade target for Montreal Canadiens at A Winning Habit (Thu Jan 8, 2026)
-
Le Canadien aurait Blake Coleman dans sa mire at HABSolument Fan (Thu Jan 8, 2026)
-
Report: Canadiens Interested In Flames Top Target at Yahoo Sports NHL (Thu Jan 8, 2026)
-
Blake Coleman : le Canadien discute de la possibilité d’aller le chercher at Dans Les Coulisses (Thu Jan 8, 2026)
-
From Kadri to Coleman, ranking the Flames’ top five goal-scorers of 2025 at Flames Nation (Sat Jan 3, 2026)
-
Instant Reaction: Flames grind out overtime win over Bruins at Flames Nation (Tue Dec 30, 2025)
-
Blake Coleman, un joueur intéressant pour le Canadien aux yeux d’Arpon Basu at Dans Les Coulisses (Mon Dec 29, 2025)
-
Would Blake Coleman be a fit for the Ottawa Senators? at The Win Column (Thu Dec 25, 2025)
-
NHL Rumors: Toronto Maple Leafs, Dallas Stars, and the Calgary Flames at NHL Rumors (Tue Dec 23, 2025)
-
Ottawa Senators Target Secondary Scoring as Playoff Push Remains Alive at The Hockey Writers (Mon Dec 22, 2025)
-
NHL Rumors: 20 teams have inquired about Blake Coleman at NHL Rumors (Mon Dec 22, 2025)
-
4 Mock Trades the Winnipeg Jets Could Make to Boost Their Offence at The Hockey Writers (Thu Dec 18, 2025)
-
3 predictions for the rest of the Flames season at Flames Nation (Wed Dec 17, 2025)
-
Four Potential Trade Targets the Pittsburgh Penguins Could Pursue in a Playoff Push at The Hockey Writers (Mon Dec 8, 2025)
-
NHL Rumors: Calgary Flames – Blake Coleman and Rasmus Andersson at NHL Rumors (Fri Dec 5, 2025)
-
Reports Suggest Maple Leafs Among Teams Interested in Blake Coleman at The Hockey Writers (Thu Dec 4, 2025)
-
Maple Leafs Weekly: Injuries, Hughes & Coleman at The Hockey Writers (Thu Dec 4, 2025)
-
Maple Leafs reportedly eyeing trade for 2-time Stanley Cup champion at Editor in Leaf (Thu Dec 4, 2025)
-
Flames News & Rumours: Cooley, Coleman, Conroy & More at The Hockey Writers (Wed Dec 3, 2025)
-
Mikael Backlund and Blake Coleman have become important mentors for young Flames at Flames Nation (Tue Dec 2, 2025)
-
NHL Nugget: Calgary Flames' Blake Coleman's Birthday Backcheck at The Hockey News (Fri Nov 28, 2025)
-
NHL Nugget: Calgary Flames' Blake Coleman's Birthday Backcheck at Yahoo Sports NHL (Fri Nov 28, 2025)
-
3 players Flyers should trade for to save their season at Broad Street Buzz (Fri Nov 28, 2025)
-
Maple Leafs Trade Targets: Tuch, Schenn & Coleman at The Hockey Writers (Wed Nov 26, 2025)
-
The Stanchies: Quinn Hughes’ attempt to drag Canucks to victory falls short in 5-2 loss to Flames at Canucks Army (Mon Nov 24, 2025)
-
Game Takes: Flames 5 Canucks 2 at Calgary Puck (Mon Nov 24, 2025)
-
Could Blake Coleman be a fit for the New Jersey Devils? at The Win Column (Fri Nov 21, 2025)
-
NHL Rumor Roundup: Latest On The Flames' Rasmus Andersson, Nazem Kadri And Blake Coleman at The Hockey News (Mon Nov 17, 2025)
-
Coleman Coveted, Brady Tkachuk Negotiations & More NHL Rumours at The Hockey Writers (Sun Nov 16, 2025)
-
Devils News & Rumors: Injury Updates, Blake Coleman, Summer Nemec Discussion at The Hockey Writers (Sun Nov 16, 2025)
-
Devils might pivot to former draft pick following Jack Hughes’ injury at Pucks and Pitchforks (Sun Nov 16, 2025)
-
Goodrow, Coleman on What Sharks Can Learn From Lightning’s Winning Formula at San Jose Hockey Now (Sat Nov 15, 2025)
-
NHL Rumors: Anaheim Ducks, Calgary Flames, Detroit Red Wings, and the Edmonton Oilers at NHL Rumors (Fri Nov 14, 2025)
-
Report: Blake Coleman is garnering trade interest around the league at Flames Nation (Fri Nov 14, 2025)
-
NHL Rumor Mill – November 14, 2025 at Spectors Hockey (Fri Nov 14, 2025)
-
Game Takes: Flames 2 Sharks 0 at Calgary Puck (Fri Nov 14, 2025)
-
NHL trade rumors: New Jersey Devils weighing reunion with fan-favorite forward at Pucks and Pitchforks (Thu Nov 13, 2025)
-
Blackhawks in strange place as favorites versus Flames at Blackhawk Up (Fri Nov 7, 2025)
-
NHL Rumors: Pavel Zacha and Blake Coleman at NHL Rumors (Thu Nov 6, 2025)
-
Flames News & Rumours: Parekh, Kadri, Coleman & More at The Hockey Writers (Tue Nov 4, 2025)
-
Is it time for the Calgary Flames to trade Blake Coleman? at The Win Column (Sat Oct 18, 2025)
-
Game Takes: Flames 4 Oilers 3 (SO) at Calgary Puck (Thu Oct 9, 2025)
-
Blake Coleman is looking to continue his strong play as a Calgary Flame at Flames Nation (Sat Oct 4, 2025)
-
6 Former Miami RedHawks Players Who Have Won a Stanley Cup at The Hockey Writers (Wed Aug 13, 2025)
-
Calgary Flames best and worst contracts at The Win Column (Mon Aug 11, 2025)
-
Revisiting the Lightning’s Blockbuster Trade for Blake Coleman at The Hockey Writers (Sat Aug 2, 2025)
-
Timo Meier is the last trace of the Blake Coleman trade after Nolan Foote decision at Pucks and Pitchforks (Tue Jul 1, 2025)
-
Game Takes: Flames 4 Ducks 1 at Calgary Puck (Fri Apr 4, 2025)
-
Calgary Flames End of Season Awards: Most Improved at Flame for Thought (Mon Apr 29, 2024)
-
Preview: New Jersey Devils to Take on Calgary Flames in Inter-Conference Matchup at Devils Army (Tue Oct 26, 2021)
-
Examining Former New Jersey Devils and Their Respective Contracts at Devils Army (Fri Sep 3, 2021)
-
New Jersey Devils Free Agents Targets: Forwards at Devils Army (Wed Jul 28, 2021)
-
Devils’ Coleman Trade: It’s OK to Feel Bad at Devils Army (Mon Feb 17, 2020)
-
A Closer Look At Some Tom Fitzgerald Quotes From Yesterday at Devils Army (Mon Feb 17, 2020)
-
Devils Coleman and Greene Traded on a Wild Day at Devils Army (Mon Feb 17, 2020)
-
Devils Look to Spoil Flyers Home Opener at Devils Army (Wed Oct 9, 2019)
-
RECAP: Coleman, Special Teams Led Devils Past Florida at Devils Army (Sun Oct 28, 2018)
-
Devils Sign Texan Duo Blake Coleman, Stefan Noesen at Devils Army (Wed Jul 18, 2018)
-
Blake Coleman, Stefan Noesen File For Salary Arbitration at Devils Army (Fri Jul 6, 2018)
-
Blake Coleman: New Jersey’s Unsung Hero at Devils Army (Wed Dec 20, 2017)
Current Contract
Blake Coleman signed a $29,400,000 6-year contract with the Calgary Flames and General Manager Brad Treliving on July 28, 2021 with an AAV of $4,900,000. This contract will start in 2021-22 and end after the 2026-27 season. In the first season of the contract the cap hit was equivalent to 6.01% of the salary cap.
Standard Contract (UFA) ( ) (0 ratings)
Blake Coleman signed a $5,400,000 3-year contract with the New Jersey Devils and General Manager Ray Shero on July 17, 2018 with an AAV of $1,800,000. This contract will start in 2018-19 and end after the 2020-21 season. In the first season of the contract the cap hit was equivalent to 2.26% of the salary cap.
Standard Contract (RFA) ( ) (0 ratings)
| Season | Age* | Clause | Cap Hit | AAV | Perf. Bonus | Sign. Bonus | Salary | Compensation | Minors Salary | Status | |
|---|---|---|---|---|---|---|---|---|---|---|---|
| 2018-19 | 26 | $1,800,000 | $1,800,000 | - | - | $1,800,000 | $1,800,000 | $1,800,000 | RFA-arb | ||
| 2019-20 | 27 | $1,800,000 | $1,800,000 | - | - | $1,800,000 | $1,800,000 | $1,800,000 | UFA | ||
| 2020-21 | 28 | $1,800,000 | $1,800,000 | - | - | $1,800,000 | $1,800,000 | $1,800,000 | UFA | ||
| Total | - | - | $5,400,000 | $5,400,000 | $5,400,000 |
Blake Coleman signed a $660,000 1-year contract with the New Jersey Devils and General Manager Ray Shero on July 26, 2017 with an AAV of $660,000. This contract will start in 2017-18 and end after the 2017-18 season. In the first season of the contract the cap hit was equivalent to 0.88% of the salary cap.
Standard Contract (RFA) ( ) (0 ratings)
| Season | Age* | Clause | Cap Hit | AAV | Perf. Bonus | Sign. Bonus | Salary | Compensation | Minors Salary | Status | |
|---|---|---|---|---|---|---|---|---|---|---|---|
| 2017-18 | 25 | $660,000 | $660,000 | - | - | $660,000 | $660,000 | $70,000 | RFA-arb | ||
| Total | - | - | $660,000 | $660,000 | $70,000 |
Blake Coleman signed a $1,360,000 2-year contract with the New Jersey Devils and General Manager Ray Shero on July 1, 2015 with an AAV of $680,000. This contract will start in 2015-16 and end after the 2016-17 season. In the first season of the contract the cap hit was equivalent to 0.95% of the salary cap.
Entry Level Contract ( ) (0 ratings)
| Season | Age* | Clause | Cap Hit | AAV | Perf. Bonus | Sign. Bonus | Salary | Compensation | Minors Salary | Status | |
|---|---|---|---|---|---|---|---|---|---|---|---|
| 2015-16 | 23 | $680,000 | $925,000 | $257,500 | $92,500 | $575,000 | $667,500 | $65,000 | ELC | ||
| 2016-17 | 24 | $680,000 | $925,000 | $232,500 | $92,500 | $600,000 | $692,500 | $65,000 | ELC | ||
| Total | $490,000 | $185,000 | $1,175,000 | $1,360,000 | $130,000 |
Career Statistics
| Regular Season | Playoffs | |||||||||||||||||||
|---|---|---|---|---|---|---|---|---|---|---|---|---|---|---|---|---|---|---|---|---|
| Season | League | Team | GP | G | A | Pts | +/- | PIM | Shots | Sh% | TOI/G | GP | G | A | Pts | +/- | PIM | Shots | Sh% | TOI/G |
| 2006-07 | T1EHL U16 | Belle Tire U16 | 29 | 12 | 16 | 28 | 30 | |||||||||||||
| 2008-09 | T1EHL U18 | Dallas Stars U18 | 46 | 21 | 24 | 45 | 120 | |||||||||||||
| 2009-10 | USHL | Tri-City | 22 | 2 | 10 | 12 | -7 | 32 | ||||||||||||
| 2009-10 | USHL | Indiana | 36 | 8 | 8 | 16 | -3 | 24 | 9 | 2 | 2 | 13 | ||||||||
| 2010-11 | USHL | Indiana | 59 | 34 | 58 | 92 | +52 | 72 | 5 | 2 | 2 | 4 | -1 | 10 | ||||||
| 2011-12 | CCHA | Miami U. | 39 | 12 | 11 | 23 | 56 | |||||||||||||
| 2012-13 | CCHA | Miami U. | 40 | 9 | 10 | 19 | 56 | |||||||||||||
| 2013-14 | NCHC | Miami U. | 27 | 19 | 9 | 28 | 65 | |||||||||||||
| 2014-15 | NCHC | Miami U. | 37 | 20 | 17 | 37 | 99 | |||||||||||||
| 2015-16 | AHL | Albany | 14 | 4 | 3 | 7 | +5 | 19 | 26 | 1,540.0 | ||||||||||
| 2016-17 | NHL | New Jersey Devils | 23 | 1 | 1 | 2 | -7 | 27 | 29 | 3.4 | 12:51 | |||||||||
| 2016-17 | AHL | Albany Devils | 52 | 19 | 20 | 39 | +21 | 56 | 4 | 1 | 1 | -1 | 6 | |||||||
| 2017-18 | WC | USA | 10 | 1 | 1 | 2 | +3 | 8 | ||||||||||||
| 2017-18 | NHL | New Jersey Devils | 79 | 13 | 12 | 25 | +7 | 50 | 146 | 8.9 | 14:24 | 5 | 2 | 2 | +1 | 4 | 16 | 12.5 | 15:24 | |
| 2018-19 | NHL | New Jersey Devils | 78 | 22 | 14 | 36 | -19 | 71 | 213 | 10.3 | 17:01 | |||||||||
| 2019-20 | NHL | New Jersey Devils | 57 | 21 | 10 | 31 | -2 | 40 | 182 | 11.5 | 17:02 | |||||||||
| 2019-20 | NHL | Tampa Bay Lightning | 9 | 0 | 1 | 1 | +2 | 16 | 18 | 0.0 | 14:42 | 25 | 5 | 8 | 13 | +6 | 31 | 65 | 7.7 | 17:53 |
| 2020-21 | NHL | Tampa Bay Lightning | 55 | 14 | 17 | 31 | +15 | 37 | 122 | 11.5 | 15:28 | 23 | 3 | 8 | 11 | +5 | 22 | 45 | 6.7 | 16:10 |
| 2021-22 | NHL | Calgary Flames | 81 | 16 | 17 | 33 | +16 | 60 | 212 | 7.5 | 14:49 | 12 | 2 | 3 | 5 | +5 | 12 | 33 | 6.1 | 14:48 |
| 2022-23 | NHL | Calgary Flames | 82 | 18 | 20 | 38 | +9 | 54 | 188 | 9.6 | 15:12 | |||||||||
| 2023-24 | NHL | Calgary Flames | 78 | 30 | 24 | 54 | +19 | 76 | 191 | 15.7 | 17:08 | |||||||||
| 2024-25 | NHL | Calgary Flames | 82 | 15 | 24 | 39 | -2 | 36 | 194 | 7.7 | 17:41 | |||||||||
| 2025-26 | NHL | Calgary Flames | 69 | 20 | 15 | 35 | +12 | 49 | 176 | 11.4 | 17:20 | |||||||||
| NHL Career | 693 | 170 | 155 | 325 | +50 | 516 | 1671 | 10.2 | 16:05 | 65 | 12 | 19 | 31 | +17 | 69 | 159 | 7.5 | 16:31 | ||